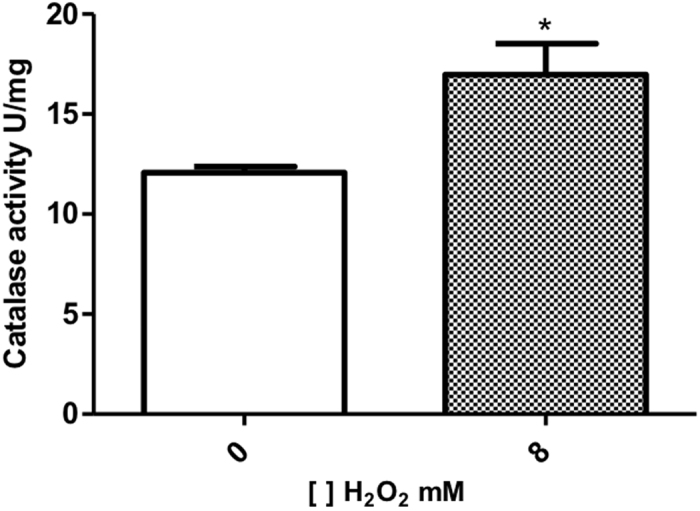
Figure 2. Catalase activity in the C. violaceum.

Each column represents the mean value ± SD of 3 separate experiments, p < 0.05. (column 1: control group; column 2: bacteria cultured with 8 mM of H2O2).

Each column represents the mean value ± SD of 3 separate experiments, p < 0.05. (column 1: control group; column 2: bacteria cultured with 8 mM of H2O2).