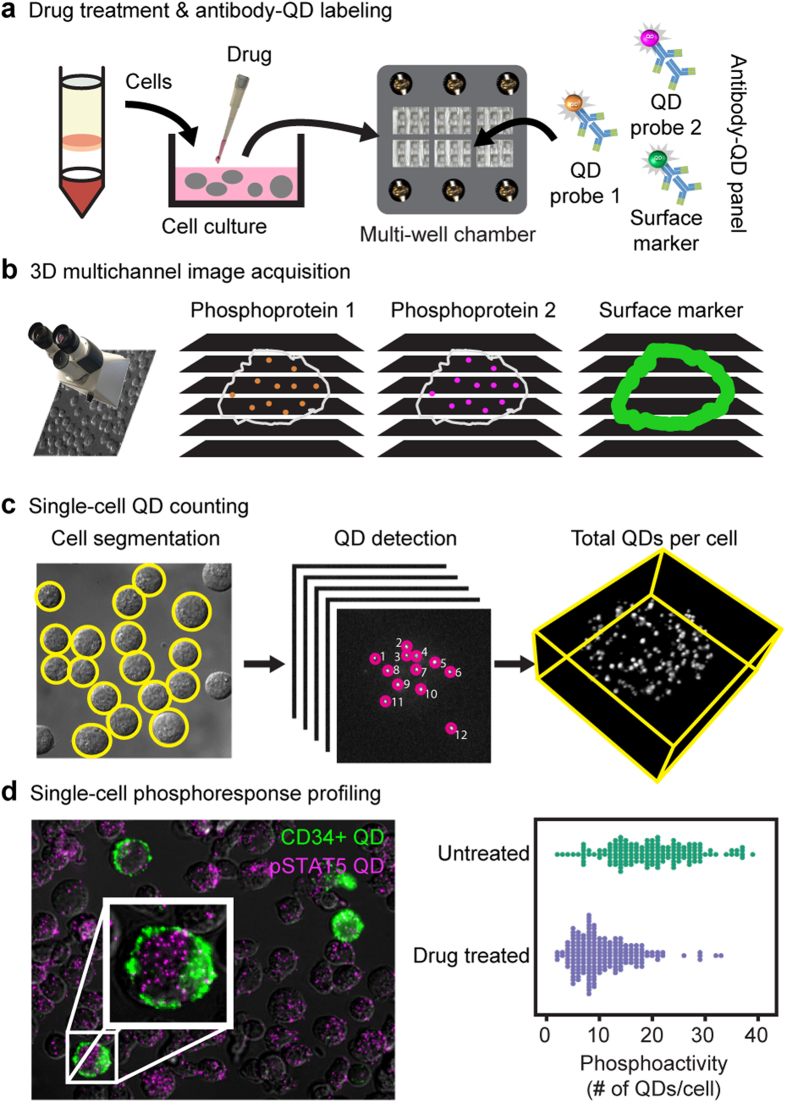
Figure 1. Digitized phosphoprotein quantitation by the single cell quantum-dot platform.
(a) Drug-treated cells are fixed, permeabilized, deposited in a multi-well glass chamber, and labeled with primary antibodies, and multicolor secondary antibody-QD probes. (b) 3D multichannel z-stack images are acquired. (c) Discrete QD-tagged protein complexes are counted from image stacks and tabulated for individual cells. (d) Single cell phosphoprofiling showing CD34 and pSTAT5 staining. Bee swarm plots depict the phosphoactivity (# of QDs/cell, x axis) for untreated cells and drug-treated cells.

