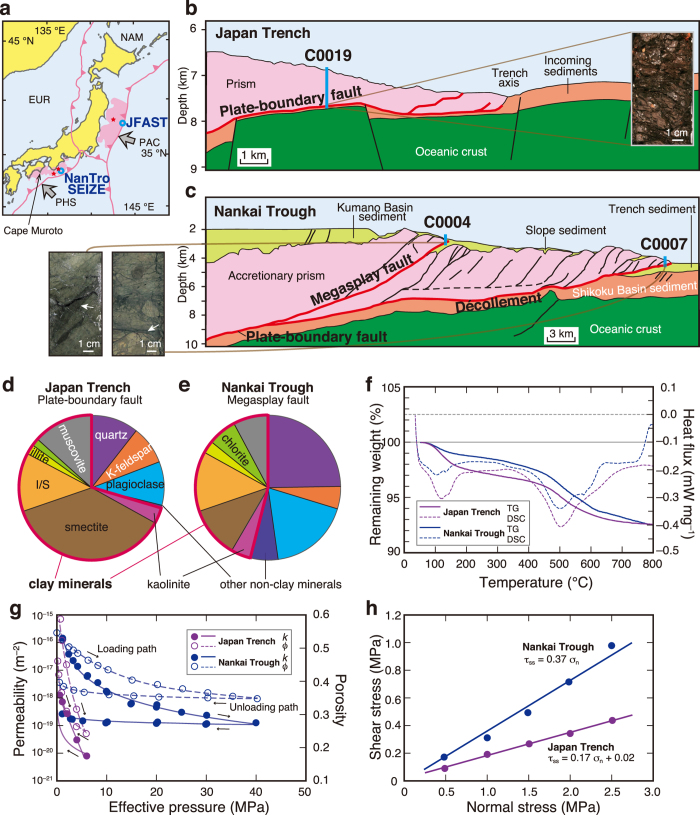
Figure 1. Drilling into rupture areas of the 1944 Tonankai and the 2011 Tohoku-oki earthquakes.
(a) Tectonic setting of the Japanese islands and drilling locations of IODP Expeditions 314–316 (NanTroSEIZE) and 343/343T (JFAST). EUR, Eurasian plate; NAM, North American plate; PHS, Philippine Sea plate; PAC, Pacific plate; pink, rupture area; red star, hypocentre; open blue circles, drilling sites. (b) Section through drilling site C0019 based on seismic data around the Japan Trench11, and a photograph of the plate-boundary fault material. (c) Section based on seismic data around the Nankai Trough through drilling sites C0004 and C000715 and photographs of the megasplay (left) and décollement (right) fault materials. (d,e) Mineral assemblages of the fault materials (d) plate-boundary fault of the Japan Trench; e, megasplay fault of the Nankai Trough). I/S, illite/smectite mixed-layer mineral (illite content >70%). The heavy red lines show the proportions of total clay minerals. (f) TG and DSC curves showing the relationships of total weight loss and heat flux to temperature. (g) Permeability (k) and porosity (ϕ) as a function of effective pressure. (h) Friction coefficients at a slip velocity of 0.01 m s−1.

