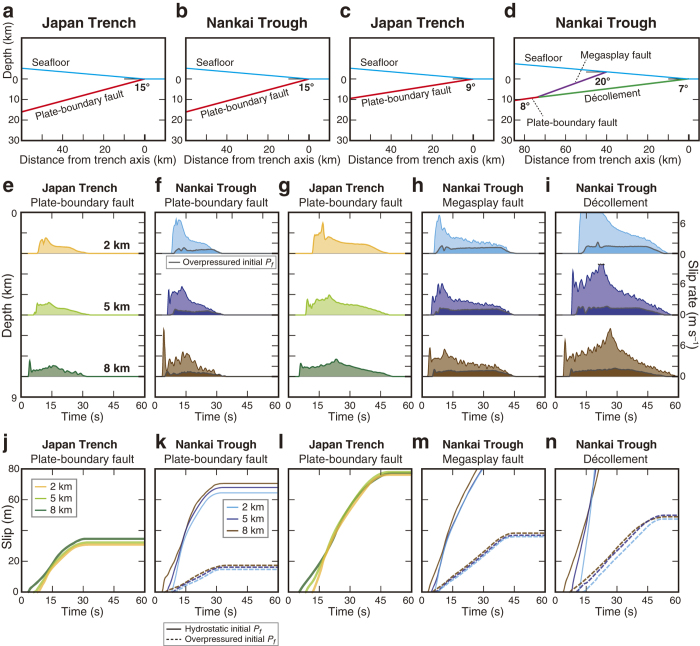
Figure 3. Spatio-temporal distribution of near-trench earthquake slip.
(a–d) Fault geometries used in our dynamic rupture modelling: (a) ideal plate-boundary fault with 15° dip in the Japan Trench; (b) ideal plate-boundary fault with 15° dip in the Nankai Trough; (c) plate-boundary fault in the Japan Trench; (d) realistic branching geometry in the Nankai Trough. (e–i) Slip rate as a function of time at representative depths (2, 5 and 8 km) along the faults. (j–n) Accumulation of slip with time at each depth. The dashed curves show the results of simulations using the overpressured initial Pf condition.

