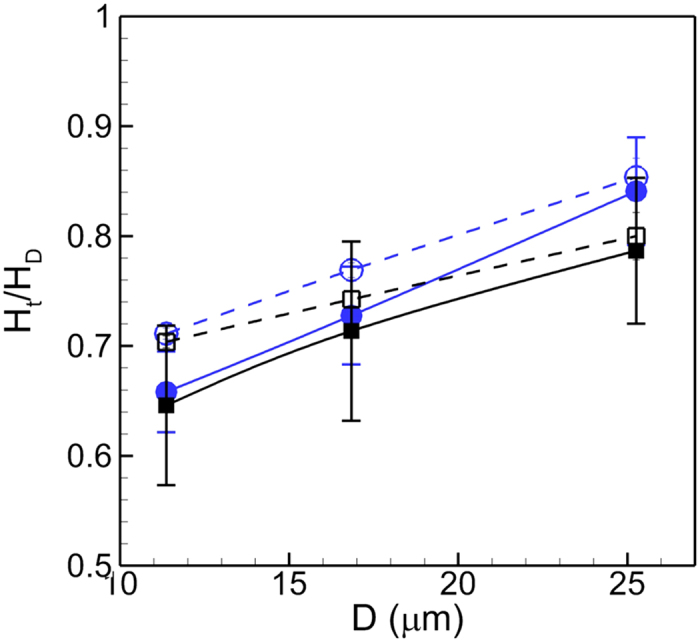
Figure 11. Comparison of the Fahraeus effect in 84% stenosed (filled symbols) and non-stenosed (unfilled symbols) vessels.

Here hematocrit ratio Ht/HD is shown as a function of tube diameter D for β = 1 (O, blue), and 3 (◻, black), for Ht = 24%. Error bars represent absolute errors.
