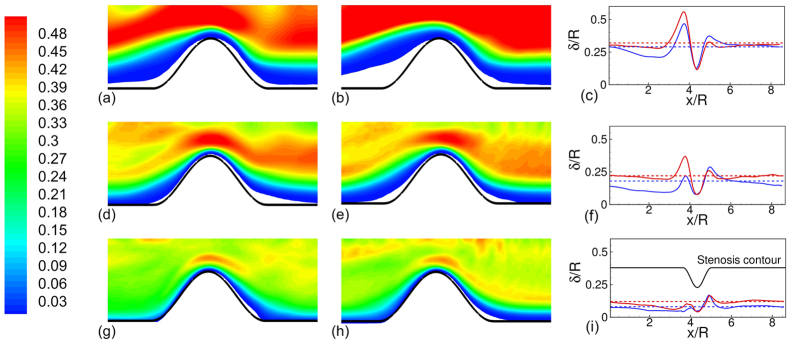
Figure 7.
Time- and azimuthally-averaged RBC distribution at β = 1 (a,d,g) and 4 (b,e,h), and spatial variation of CFL thickness δ/R (c,f,i) for D = 11 μm (a–c), 17 μm (d–f), and 25 μm (g–i). For the RBC distribution, contours are plotted from 0 (blue) to 0.5 (red) with 0.01 increment. For the CFL thickness, dotted lines are for non-stenosed vessels, continuous lines for stenosed vessels, β = 1 (blue) and 4 (red). Here  = 84%, and Ht = 24%. Here R is the vessel radius in non-stenosed section.

