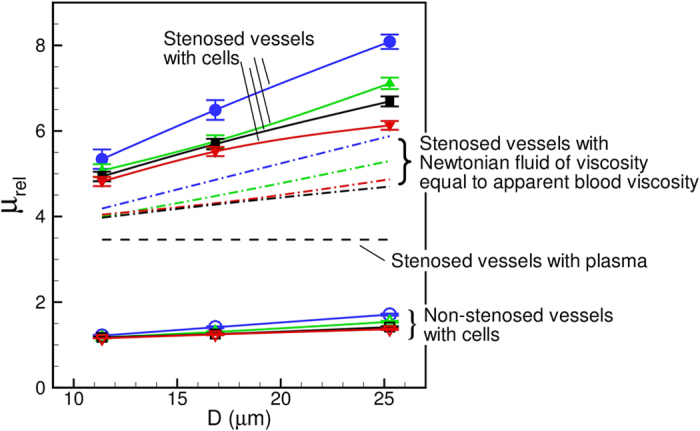
Figure 9. Apparent viscosity of blood showing a significant enhancement of the Fahraeus-Lindqvist effect in the stenosed vessels.

Lines with unfilled symbols are for non-stenosed tubes with RBCs, and lines with filled symbols are for stenosed tubes ( = 84%, Ht ≈ 22–24%) with RBCs, for various values of
  = 1 (O, blue), 2 (Δ, green), 3 (◻, black), 4 (∇, red). Dash line is for stenosed tubes with plasma only. Dash-dot lines are for stenosed tubes with Newtonian fluids having viscosities same as the apparent viscosity of blood in non-stenosed tubes of the same diameters.
