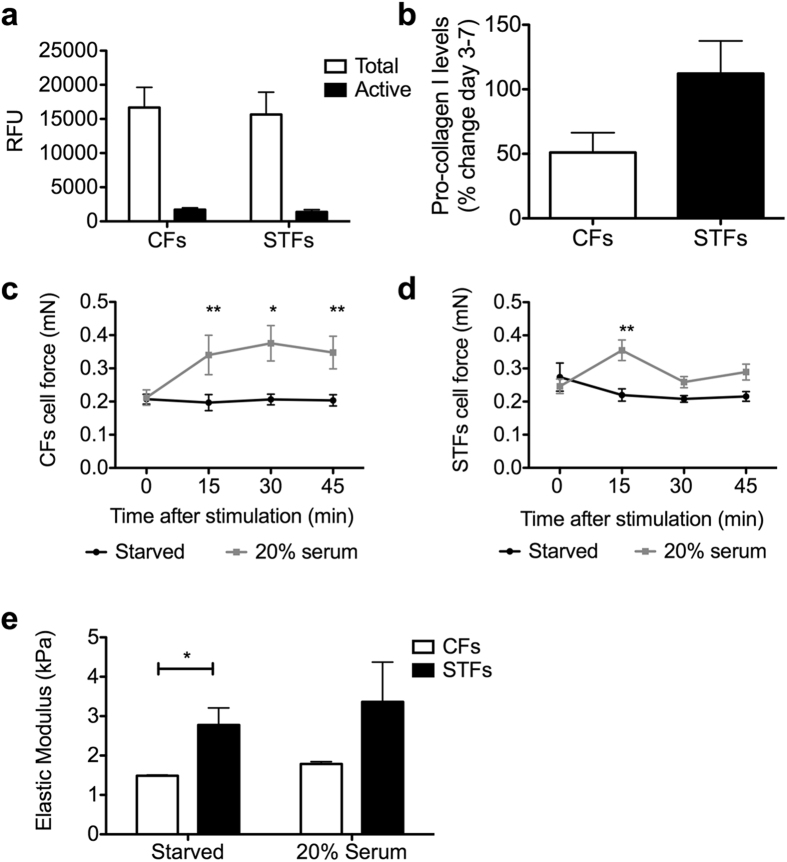
Figure 2. Scarring trachoma fibroblasts display altered force responses and matrix remodelling properties.
(a,b) CFs and STFs (8 different cell lines each) were embedded in collagen gels for contraction in the presence of 10% serum and the culture medium was collected on days 3 and 5 for measurement of (a) MMP release (Active fraction and total amount following APMA activation), and (b) and day 3 to day 7 for neo-collagen synthesis. Shown are the means +/− SEM of 8 CFs and 8 STFs (n = 2–3 for each cell line). (c–e) CFs (c) and STFs (d) were embedded in collagen gels in MC-8™ micro-chambers and cultured for 2 days to generate tissues. The tissues were starved for 48 hours and cellular force was measured every 15 min after the addition of 20% serum. A mock stimulated control set (Starved) was done in parallel for each experiment. Shown is cell force, with mean +/− SEM for n = 1–3 for 8 CFs and 8 STFs (**<0.01, *<0.05, significantly different from time 0, 2-way ANOVA, Benferroni post-test). (e) Force measurements were acquired for CFs (C24, C30, C31) and STFs (F10, F11, F12) as in (c,d) above and the Elastic modulus (E) of the tissues was extracted from the matrix force formula Fm = E x A, where A is the tissue cross-section area. Shown is the mean+/− SEM (n = 4 for each cell line with 3 time points upon stimulation; *p = 0.0152, two-tailed t-test).

