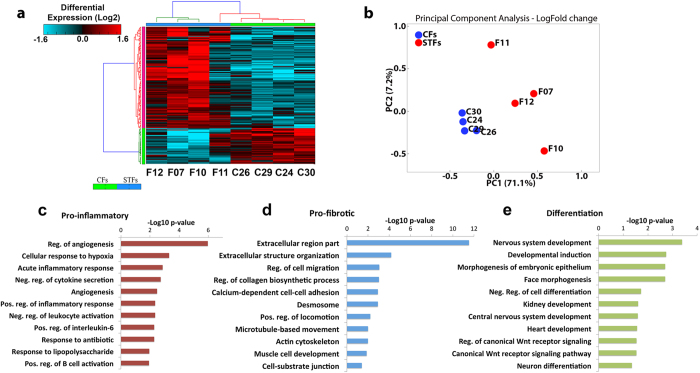
Figure 3. Scarring trachoma fibroblasts display a distinct gene expression profile.
(a) Heat map of transcriptional changes in 187 protein-coding genes in 4 CFs (C26, C29, C24, C30) and 4 STFs (F12, F07, F10, F11). Genes were clustered using hierarchical average linkage clustering and euclidean distances. The vertical and horizontal bars adjacent to the heatmaps are coloured based on a flat cluster threshold of 0.7 (distance criterion). (b) Principal component analysis shows close clustering of CFs whilst STF samples are more variable. (c–e) Gene ontology analysis of differentially expressed genes, as predicted by GO-Elite (z-score >2, Fisher’s exact p-value <0.05).

