
Figure 1. Box-and-whisker plots demonstrating serum GFAP and UCH-L1 concentrations cases with mild (GCS 13 to 15), moderate (GCS 9 to 12) or severe TBI (GCS 3 to 8) compared with controls.
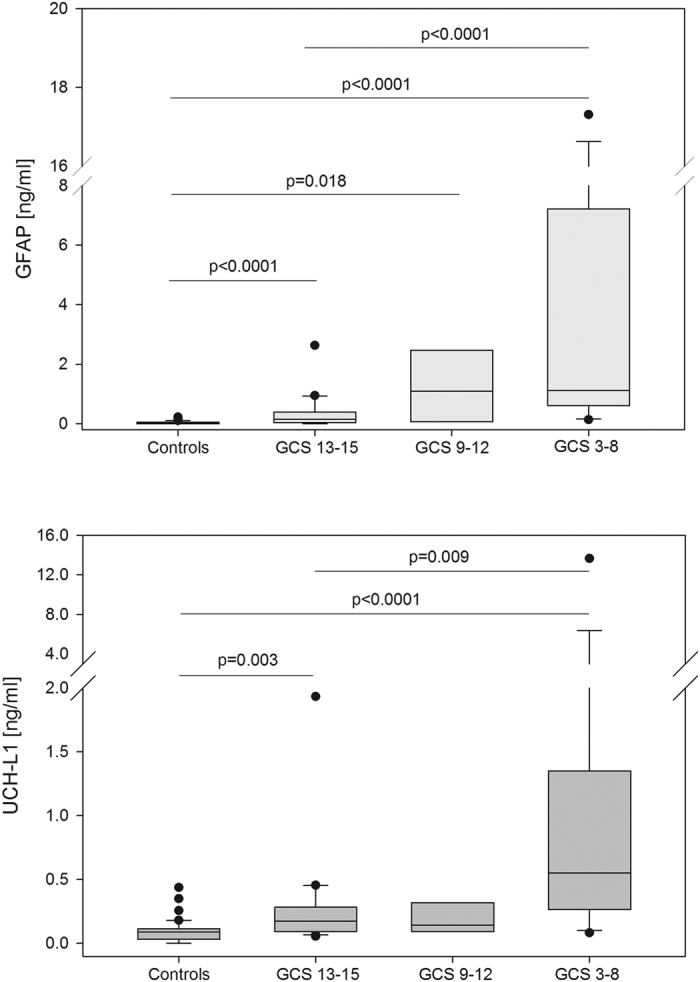
The black horizontal line in each box represents the median, with the boxes representing the interquartile range. Significant differences are indicated (Jonckheere-Terpstra test).