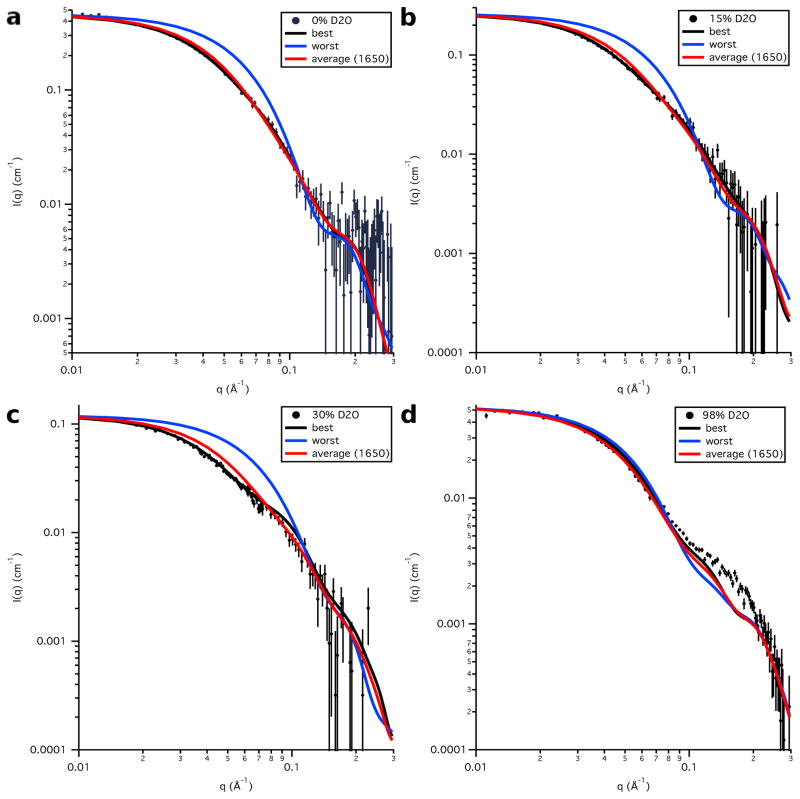
Figure 16.
Model SANS data calculated from the best-fit and worst-fit single S3e24PP5 structures, as well as the average SANS curve calculated from the entire S3e24PP5 ensemble, along with the SANS data on an absolute scale for Skp-OmpA in a) 0 % D2O, b) 15 % D2O, c) 30 % D2O and d) 98 % D2O. Error bars represent the standard error of the mean with respect to the number of pixels used in the data averaging.

