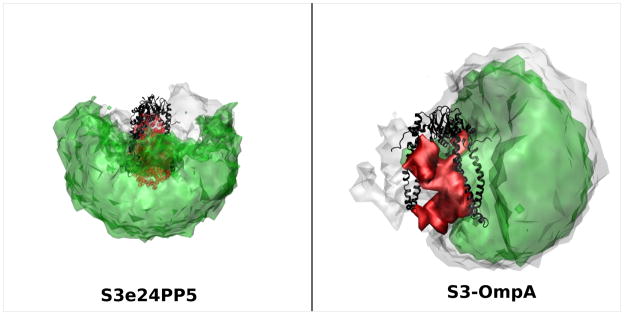
Figure 20.
Structure density plots representing all of conformation space (grey) and the best-fit conformation space within the rectangles in Figures 13 and 15 (green) explored by the OmpA PP domain using the S3e24PP5 and S3-OmpA models. The OmpA TM domain is shown in red and Skp in shown in black.

