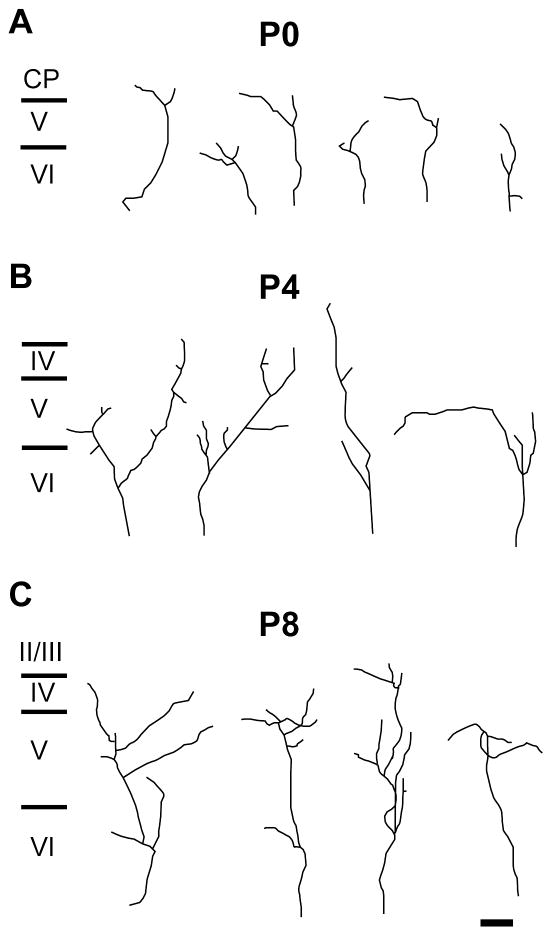
Fig. 4.
Morphology of single POm TCA arbors in developing mouse barrel cortex.
Representative examples of single, DiI-labeled POm TCAs in the PMBSF at P0 (A), P4 (B) and P8 (C). Individual arbors were selected from a total of 35 axons at P0 (n = 6 mice); from a total of 51 axons at P4 (n = 8 mice); and from a total of 43 axons at P8 (n = 9 mice). Scale bar = 100 μm in C (applies to A–C).

