Fig 3.

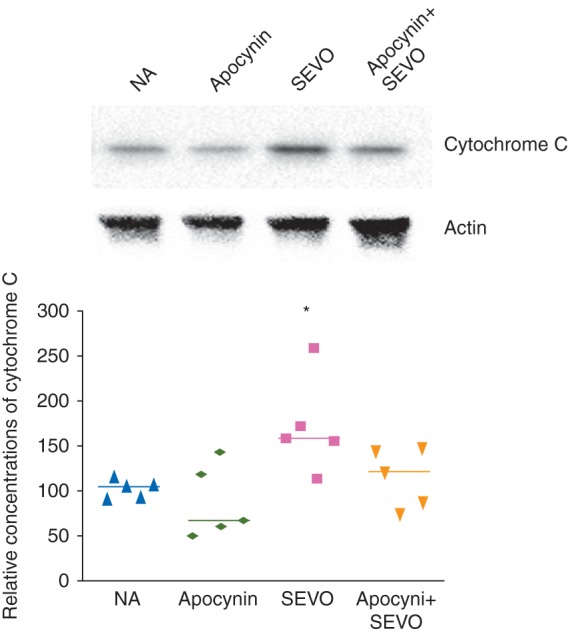
Representative image and relative concentrations of cytochrome C in the brain 6 h after sevoflurane exposure (*P<0.05, NA vs SEVO, n=5 each).

Representative image and relative concentrations of cytochrome C in the brain 6 h after sevoflurane exposure (*P<0.05, NA vs SEVO, n=5 each).