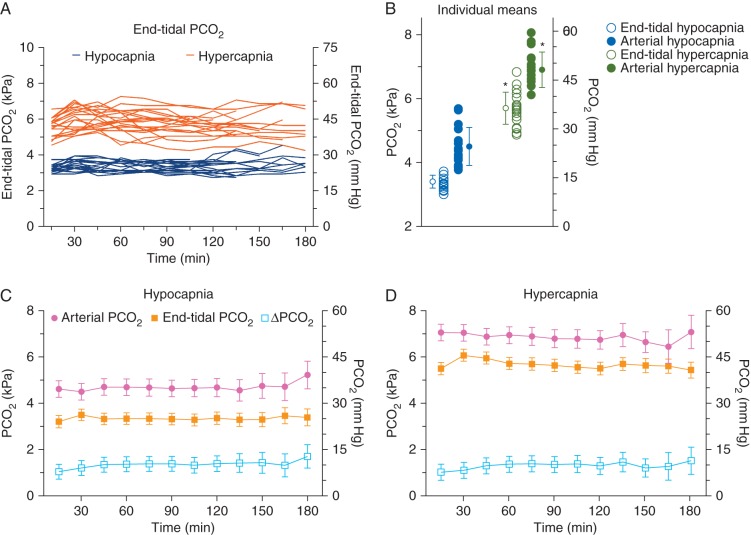
Fig 2.
(a) Individual end-tidal values over time. Blue lines hypocapnia, orange lines hypercapnia. (b) Individual mean end-tidal and arterial values and mean of the means (sd). *P<0.001. (c and d) Profiles of the arterial , end-tidal and difference between arterial and end-tidal () under hypocapnic (c) and hypercapnic conditions (d). Data are mean (95% confidence interval).

