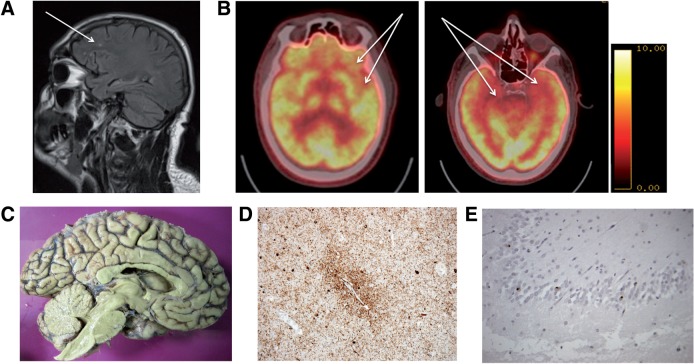
FIGURE 1.
MRI and PET imaging. (A) Fluid attenuated inversion recovery sequence, sagittal orientation. Arrow indicates white matter abnormalities in an area of tissue sampling (left frontal). (B) Fludeoxyglucose (18F), FDG-PET imaging. Arrows indicate areas of hypometabolism in the left inferior frontal and anterior temporal (left) and bilateral medial temporal areas (right). (C) Medial view of the left cerebral hemisphere showing minimal anterior frontal atrophy. (D) Perivascular phospho-Tau deposition. (E) Cytoplasmic TDP-43 accumulation in dentate fascia neurons.

