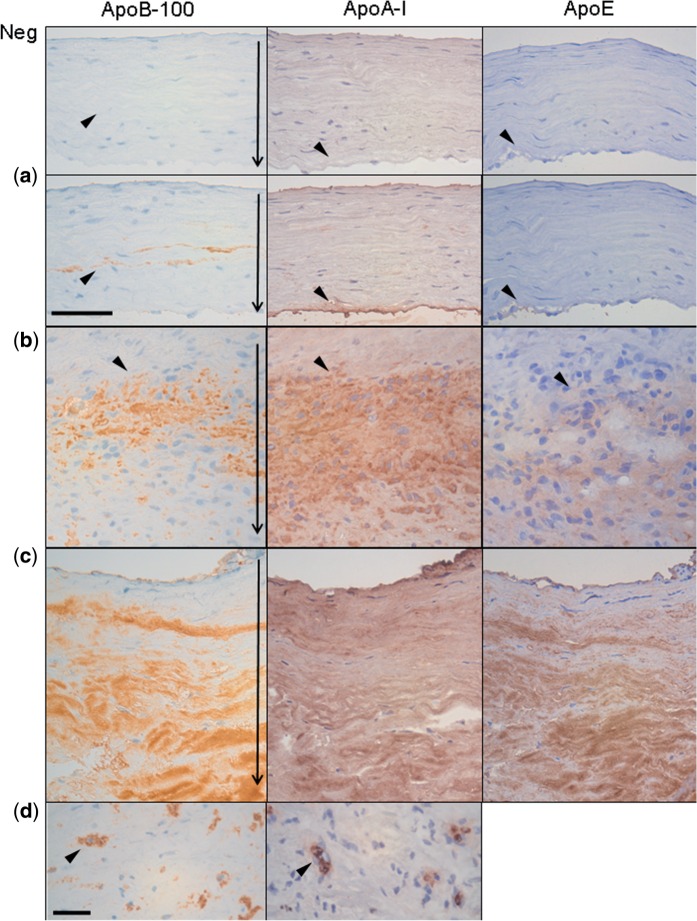
FIGURE 3.
apoA-I, apoB-100, and apoE in degenerated saccular intracranial aneurysms (sIAs, adjacent sections; see arrowheads). (a–c) Apolipoproteins in type A (a), type B (b), and type C walls (c) (9). (d) Intracellular stainings apoA-I and apoB-100. The thin arrows in the panels showing apoB-100 staining point to the sIA wall orientation similarly in Figure 1. Scale bars: a–c, 50 μm; d, 25 μm.

