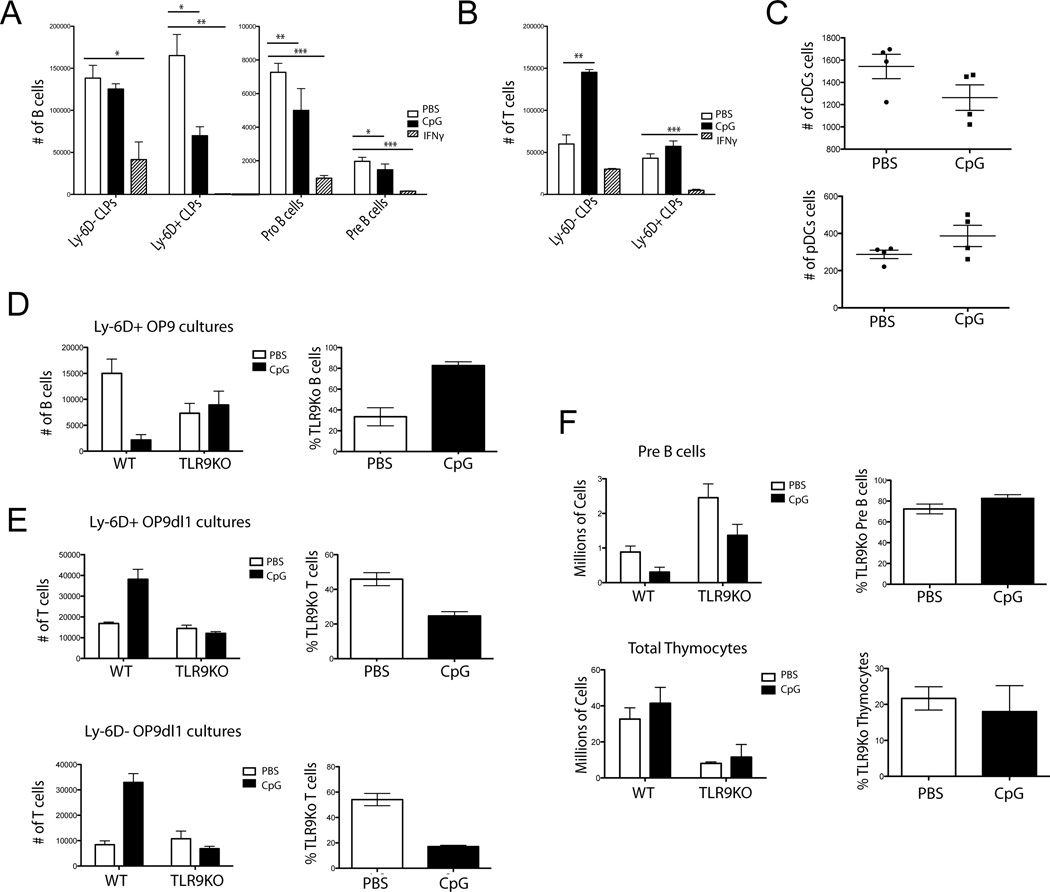
Figure 2. CpG and IFN-γ differentially inhibit B-cell lymphopoiesis.
A) Ly-6D− and Ly-6D+ CLPs, Pro and Pre B cells were sorted from WT mice and grown in vitro on OP9 stromal cells with 0.6 µg CpG, 100 pg IFN-γ or PBS and cell numbers were determined by flow cytometry. Bars depict a representative mean + SEM from 3 independent experiments with 4 replicates per experiment. B) Ly-6D− and Ly-6D+ CLPs were sorted and grown on OP9-dl1 co-cultures with CpG, 100 pg IFN-γ, or PBS and cell numbers were determined by flow cytometry. Bars depict mean + SEM representative from 3 independent experiments with 4 replicates per experiment C) CLPs were plated in DC promoting culture conditions with CpG or PBS and cell numbers were determined by flow cytometry. Each dot shows an individual mouse. Data are representative of 3 experiments with 4 replicates per experiment. D) 250 each WT CD45.1 and TLR9KO CD45.2 Ly-6D+ CLPs were mixed and grown on OP9 stromal cells with CpG or PBS and cell numbers were determined by flow cytometry. Left graph represents absolute numbers of CD19+ cells per well as counted by flow cytometry. Data were modeled using genotype and PBS/CpG treatment as independent variables in a 2-way ANOVA looking for a statistically significant interaction term to determine a differential effect of CpG on genotype for cell counts (p=0.0064 interaction, 2-way ANOVA). Graph on right represents the same data as % TLR9KO cells per well. Bars represent mean + SEM. Mixed cultures are representative of 5 experiments with 4 replicates per group. E) Cultures were set up as in part D but on OP9dl1 stromal cells. Top represents plated Ly-6D+ CLPs and the bottom Ly-6D− CLPs. Statistical analysis was performed as in part D. T-cell OP9dl1 co-cultures Ly-6D+ (p=0.0027 interaction, 2-way ANOVA) and Ly-6D− (p<0.0001 interaction, 2-way ANOVA). Graphs on right represent the same data as % TLR9KO cells per well. Bars represent mean + SEM. Mixed cultures are representative of 5 experiments with 4 replicates per group. F) Mixed bone marrow chimeras were made using 50:50 WT and TLR9 congenically marked bone marrow. After reconstitution, mice were treated with repeated CpG dosing regimen and cell numbers were determined by flow cytometry. Left graphs represent numbers of Pre B cells from tibias and femurs (p=0.3736 interaction, 2-way ANOVA) or thymocytes (p=0.6601 interaction, 2-way ANOVA). Right graphs represent % TLR9KO Pre B cells or Thymocytes from treated mice. Mixed chimeras are representative of 2 experiments with 7 mice per group. For OP9 experiments B cells are defined as being CD19+ B220+, T cells as being CD90+ NK1.1−, cDCs as CD11c+ CD11b+ B220− NK1.1− and pDCs as CD11c+ B220+ CD11b− NK1.1−.* = p<0.05, ** = p<0.005, *** = p<0.0005, unpaired t-test.

