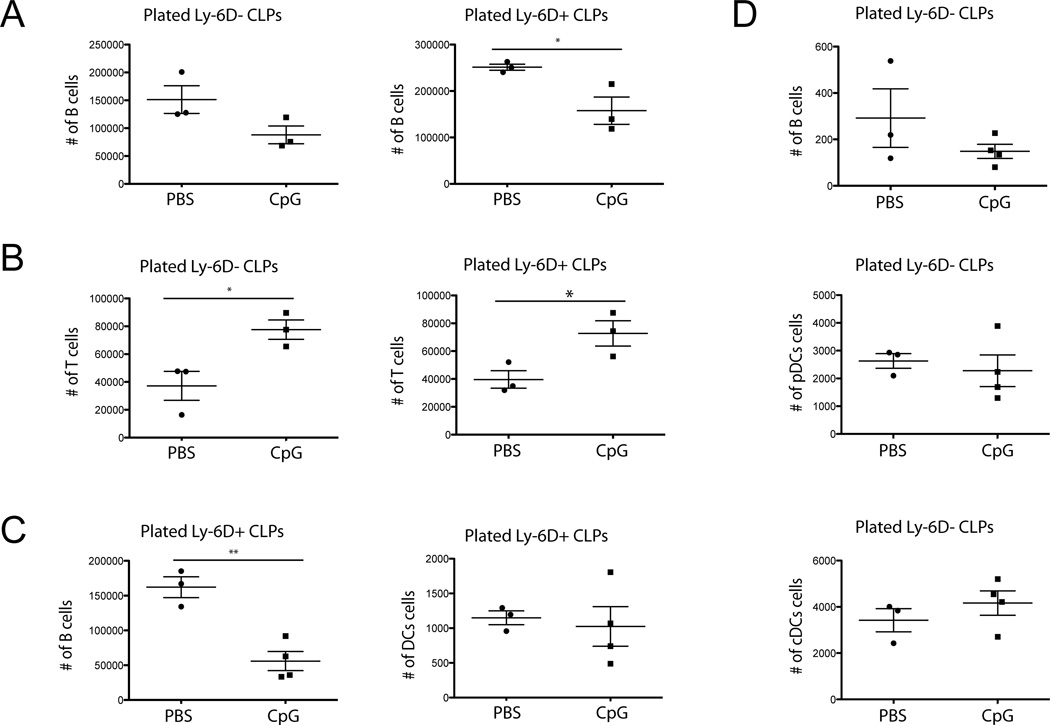
Figure 4. CpG induced inflammation skews CLPs away from the B-cell fate.
(A, B) CLPs were sorted from WT mice treated with repeated CpG or PBS. A) Sorted CLPs were grown on B-cell OP9 cultures and the number of B cells was determined by flow cytometry. B) Sorted CLPs were grown on T-cell OP9-dl1 cultures and the number of T cells was determined by flow cytometry. Each dot shows one mouse. Data are representative of 5 experiments with 3 mice per group. (C, D) Sorted CLPs were grown on OP9 cultures with DC culture conditions. C) Ly-6D+ CLPs. D) Ly-6D− CLPs. Numbers of B clls and DCs were determined by flow cytometry. Each dot shows one mouse. Data are representative of 2–5 experiments with 3–4 mice per group. * = p<0.05, ** = p<0.005, unpaired t-test.

