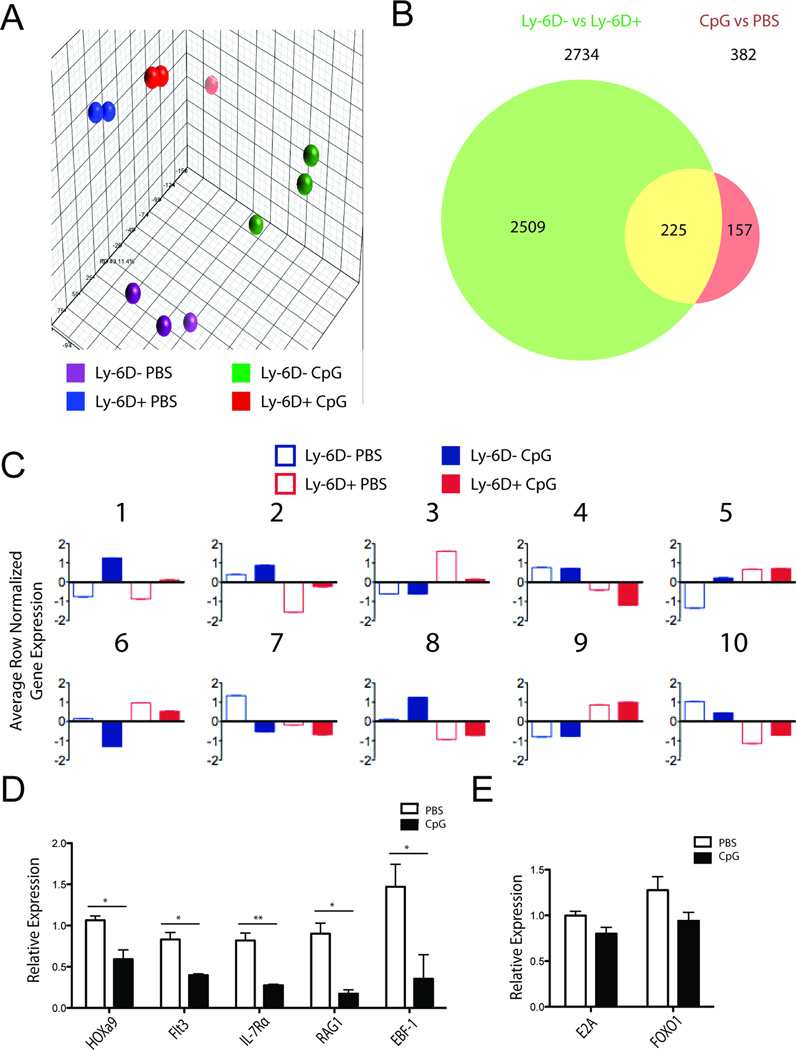
Figure 5. Ly-6D expression and CpG treatment induce transcriptional profile changes.
A) Principle component analysis from microarray of Ly-6D+ and Ly-6D− CLPs from CpG and PBS treated mice. B) Venn diagram of significant genes from 2-way comparison of microarray data sets. False discovery rate was set to 20%. C) Results of K means clustering using k=10 of differentially expressed genes with a false discovery rate of 20%. Average row normalized gene expression for each population in each cluster is presented. (D, E) Ly-6D− CLPs from three PBS and three CpG treated mice were analysed by qRT-PCR. D) HOXa9 and its downstream targets. E) E2A and its unique target FOXO1. Data show mean + SEM from 3 individual samples. Expression of the gene relative to β-actin is shown. * = p<0.05, ** = p<0.005, Student’s t-test

