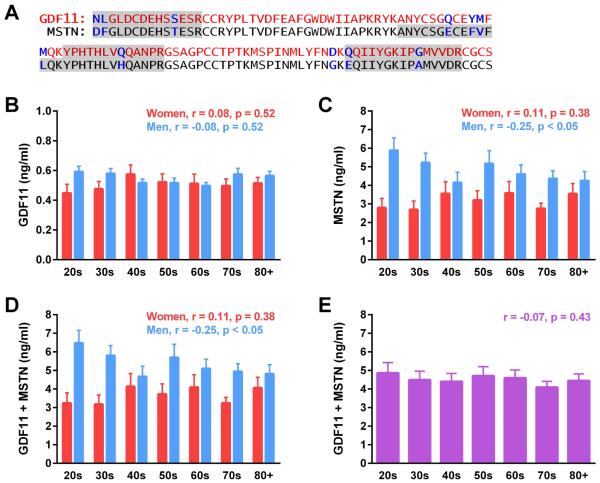
Figure 1. Quantitative analysis of GDF11 and MSTN by LC-MS/MS throughout human aging.
(A) Amino acid sequence of active human GDF11 (red) and MSTN (black), indicating differing residues (blue). Shading demarcates MS signal peptides monitored for quantification. (B) GDF11 and (C) MSTN levels were quantified in healthy women and men corresponding to the indicated ages in years. Concentrations of GDF11 and MSTN were combined and compared in a (D) sex-dependent and (E) sex-independent manner throughout aging (n=10 per sex and decade; linear regression assessment.)

