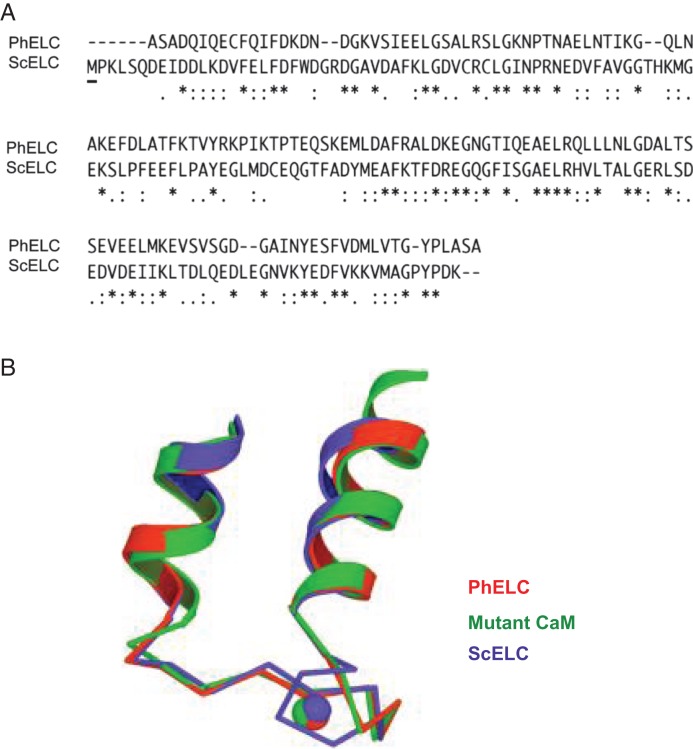
Figure 4.
Comparisons of amino acid sequences and structure of the Ca 2+-binding EF-hands between PhELC and ScELC (A) Comparisons of amino acid sequences between PhELC and ScELC using the program of CLUSTAL W (1.83). The first row shows amino acid sequences of PhELC and the second row shows that of ScELC. ’*’ indicates positions that have a single, fully conserved residue; ’:’ indicates that ’strong’ group is fully conserved; ’.’ indicates that ’weaker’ group is fully conserved. The underlined letter ’M’ in the beginning of second row indicates the only one methionine in N-lobe of ScELC. (B) Structure and comparison of the Ca2+-binding EF-hand I of PhELC (red), ScELC (blue), and mutant CaM (green) [25]. Note that the extra turn in the first helix of ScELC. Adapted from Debreczeni et al. [25].

