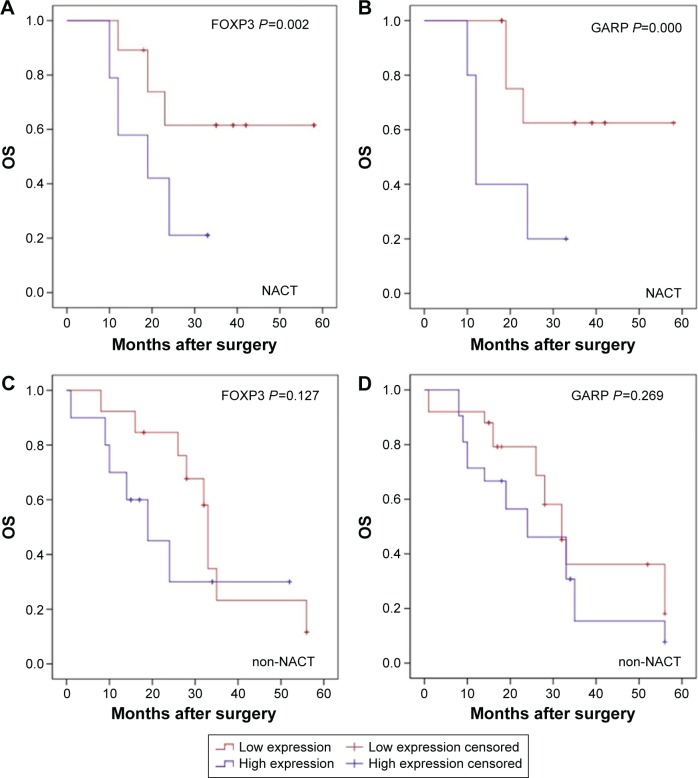
Figure 2.
Kaplan–Meier analysis of OS.
Notes: (A) Patients in the NACT group with decreased infiltration of FOXP3+ Tregs had longer OS (log-rank test, P=0.002); (B) No significant difference was seen between the infiltration of FOXP3+ Tregs in patients in the non-NACT group (log-rank test, P=0.127). (C) Patients in the NACT group with decreased infiltration of GARP+ Tregs had longer OS (log-rank test, P<0.001); (D) No significant difference was seen between the infiltration of GARP+ Tregs in patients in the non-NACT group (log-rank test, P=0.269).
Abbreviations: NACT, neoadjuvant chemotherapy; OS, overall survival; Tregs, regulatory T-cells.

