
Fig. 1.
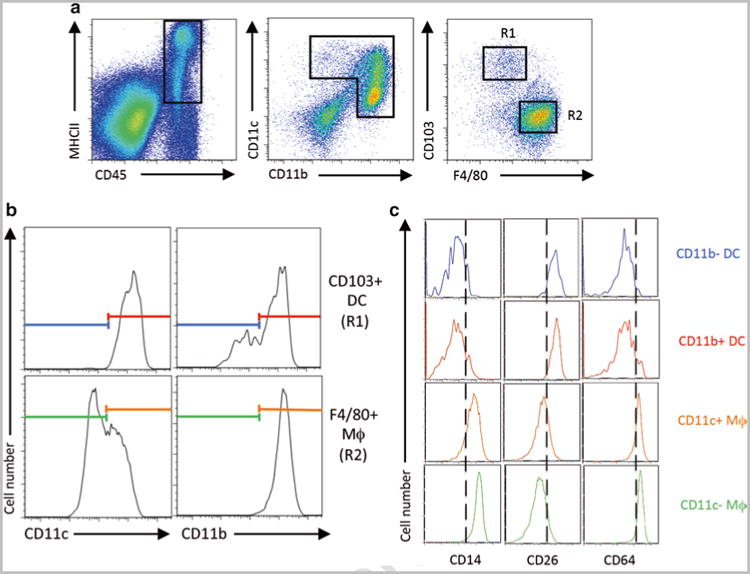
Representative analysis for macrophages and DCs in the intestine by multi-color flow cytometry. (a) Small intestinal lamina propria living CD45 + MHCII+ cells were analyzed for CD11c and CD11b expression and consequently the resulting populations were separated for CD103+ DCs (R1) and F4/80+ macrophages (R2). (b) CD103+ DCs (R1) and F4/80+ macrophages (R2) were divided by CD11c and CD11b expression. (c) Expression of CD14, CD26, and CD64 was analyzed for CD11b- DC, CD11b + DC, CD11c + macrophages, and CD11c- macrophages with colors corresponding to the populations defined in panel b