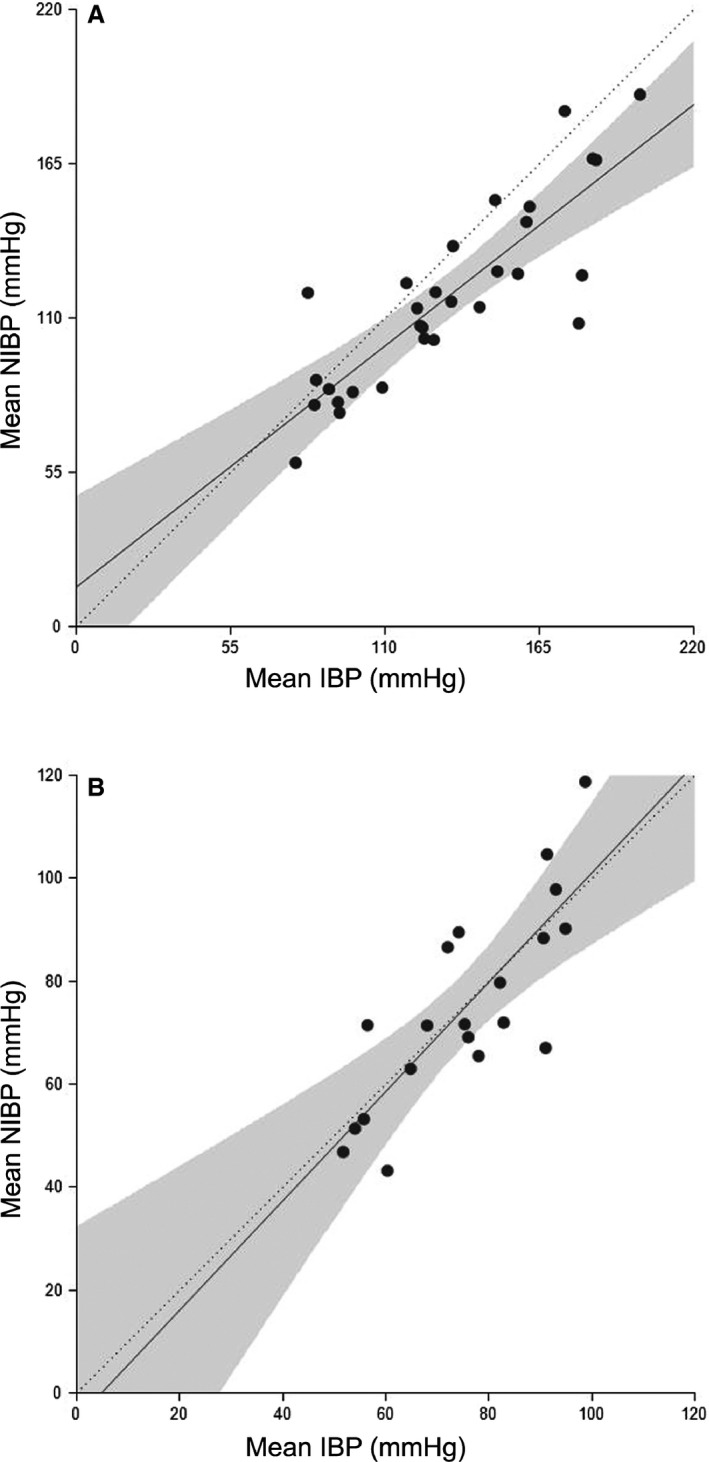
Figure 1.

Mean noninvasive blood pressure (NIBP) values plotted against the invasive blood pressure (IBP) (n = 8) in the standing horse (A) and under general anesthesia (GA) (B). The solid line represents the regression line, the dotted line the 45° line and the filled area the confidence band.
