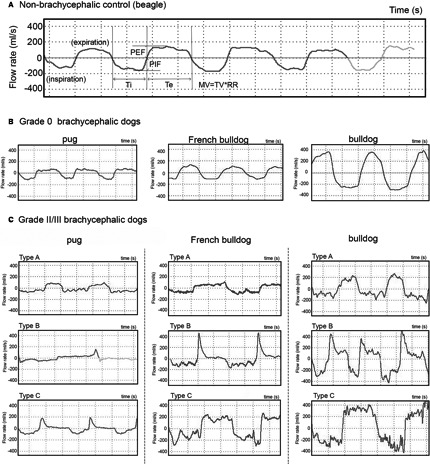
Figure 3.

Respiratory flow trace samples. (A) Flow traces of a nonbrachycephalic control; (B) Flow trace samples of Grade 0 brachycephalic dogs; (C) Flow trace samples of Grade II/III brachycephalic dogs, showing variations in amplitude, flow pattern, and noise within the trace. Take French bulldog as an example, Type A shows extremely low amplitude when compared to Type B and C; however, the peak flow rates of inspiration and expiration are equal while they are significantly different in Type B. Noise, low amplitude high frequency fluctuations can be seen in all three types mainly during inspiration.
