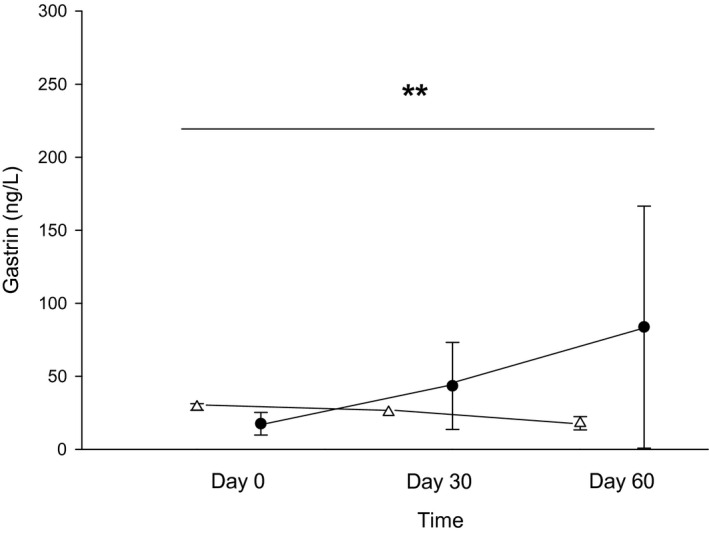
Figure 5.

Serum gastrin concentrations (ng/L) between days 0 (before treatment), 30 (after 4 weeks of treatment with either 250 mg lactose PO q12h or 5 mg omeprazole PO q12h), and 60 (after 8 weeks of treatment) of each treatment arm. White triangles (placebo) and black circles (omeprazole) represent the mean ± SD of gastrin for days 0, 30, or 60 with each treatment arm. **Omeprazole (black circles) results in a significant increase in serum gastrin compared with placebo (white triangles) (P = 0.002).
