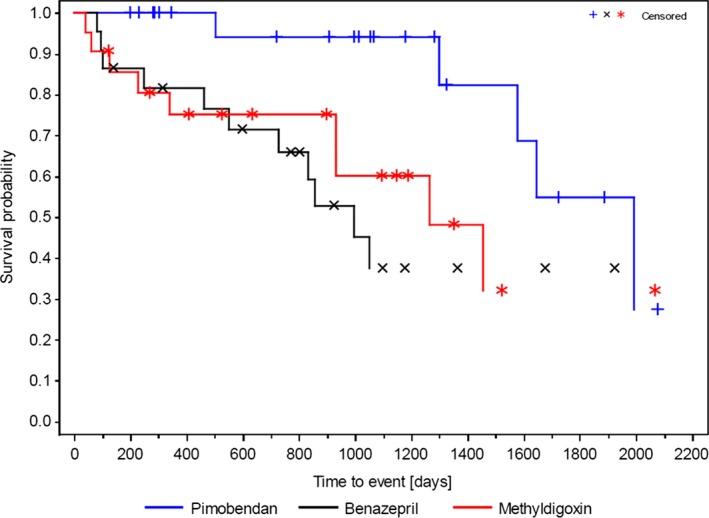
Figure 2.

Kaplan–Meier survival curves for time to primary endpoint (CHF, SD), (Per Protocol Set, n = 66). Comparison by log‐rank test between pimobendan and benazepril HCl (P = .008) and between pimobendan and methyldigoxin (P = .031) were statistically significant, respectively. Because of right censoring, the 25% quartile could not be calculated.
