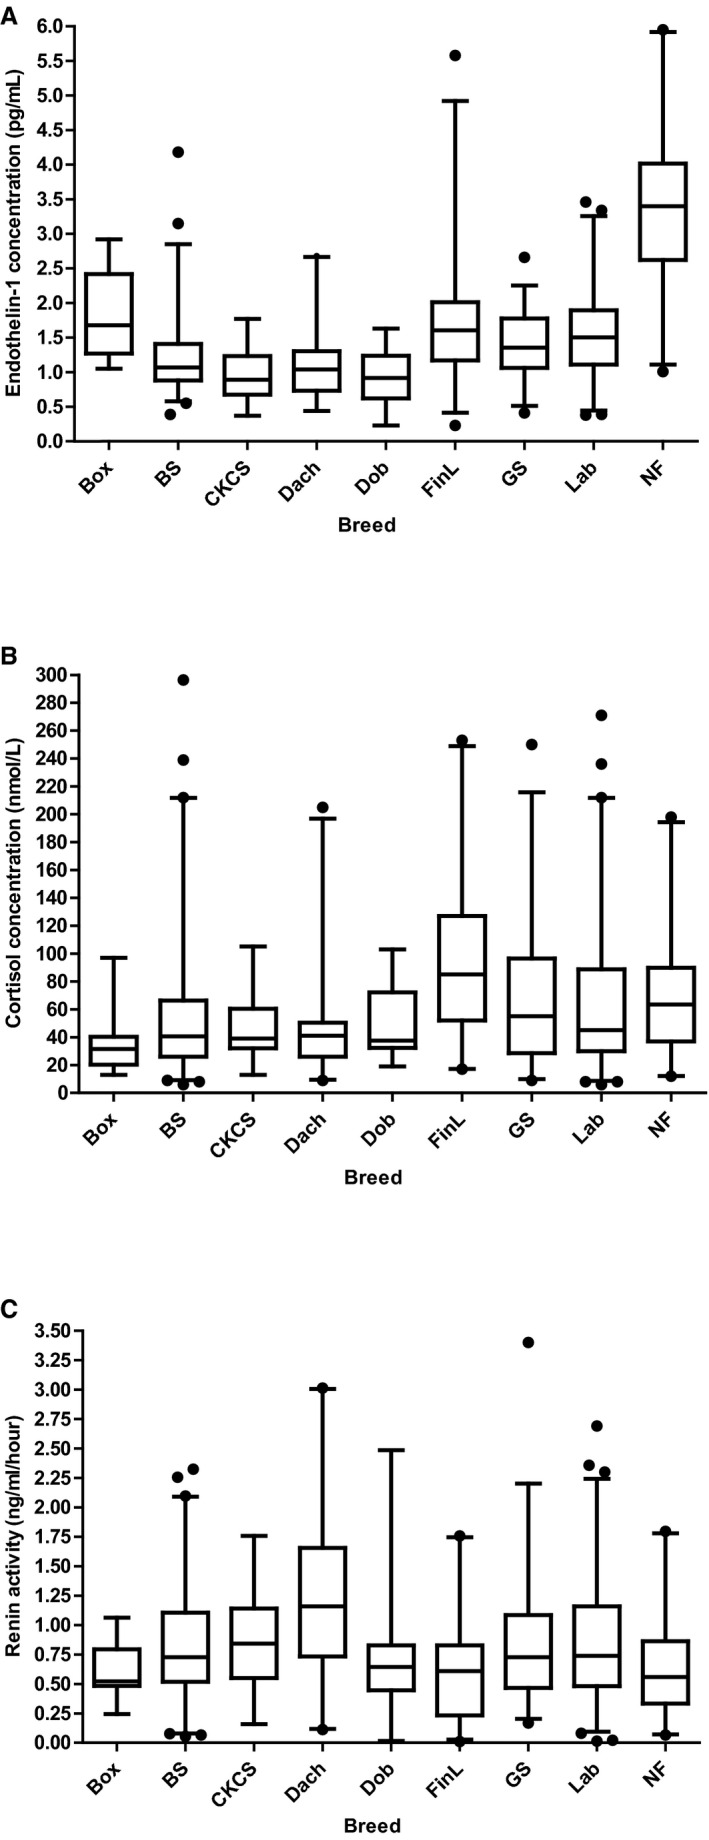
Figure 1.

Boxplots showing distribution of endothelin‐1 (A), cortisol (B), and renin activity (C) by breed. The top, bottom, and line within each box correspond to the 75th percentile (top quartile), the 25th percentile (bottom quartile), and the 50th percentile (median), respectively. The whiskers extend from the bottom 2.5th percentile to the top 97.5th percentile. Outliers, represented by black dots, were included in statistical analyses. There was an overall significant breed difference for all 3 substances (P < .0001). For information on which breeds that differed significantly, see Table 3. Box, Boxer; BS, Belgian Shepherd; CKCS, Cavalier King Charles Spaniel; Dach, Dachshund; Dob, Doberman pinscher; FinL, Finnish Lapphund; GS, German Shepherd; Lab, Labrador retriever; NF, Newfoundland.
