
Figure 2.
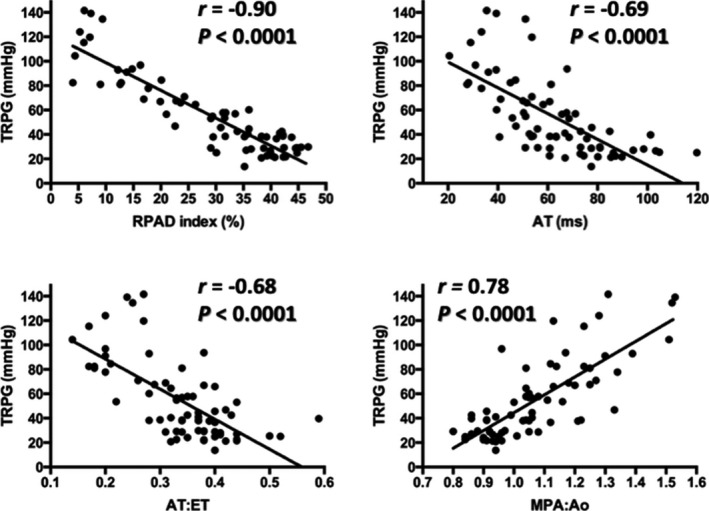
Scatter plots illustrating significant (all P < .0001) correlations (r) between peak tricuspid regurgitation systolic pressure gradient (TRPG) and the 4 indirect echocardiographic indices of pulmonary hypertension: right pulmonary artery distensibility (RPAD) index (upper left), acceleration time to peak pulmonary artery flow (AT; upper right), acceleration time to peak pulmonary artery flow to ejection time of pulmonary artery flow ratio (AT:ET; lower left), and main pulmonary artery to aorta internal diameter ratio (MPA:Ao; lower right). The solid line within each scatter plot represents the line of best fit.