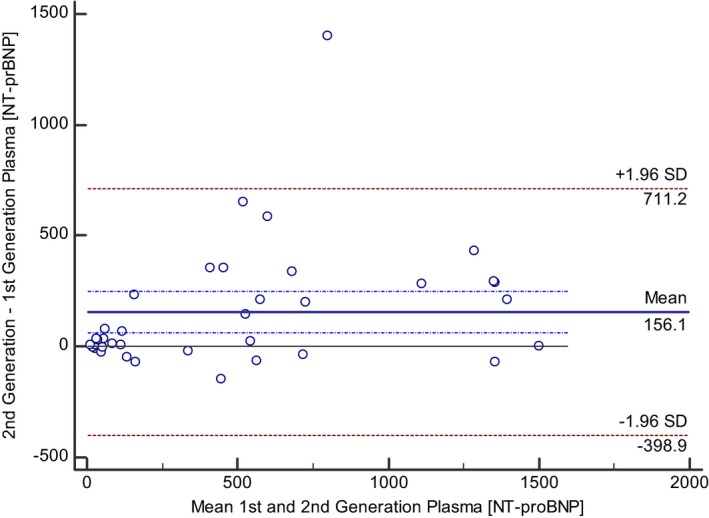
Figure 2.

Bland–Altman plot illustrating agreement between measurements of NT‐proBNP concentrations in plasma samples from cats using the first‐ and second‐generation assay in samples from the UK cohort. The mean bias and the dash‐dot lines representing the 95% confidence intervals for the bias indicate that the NT‐proBNP concentration of plasma samples using the second‐generation assay was on average 156.1 pmol/L greater than NT‐proBNP concentration from paired plasma sample using the first generation assay. The 95% limits of agreement between the two sample types are displayed as ±1.96 times the standard deviation of the difference.
