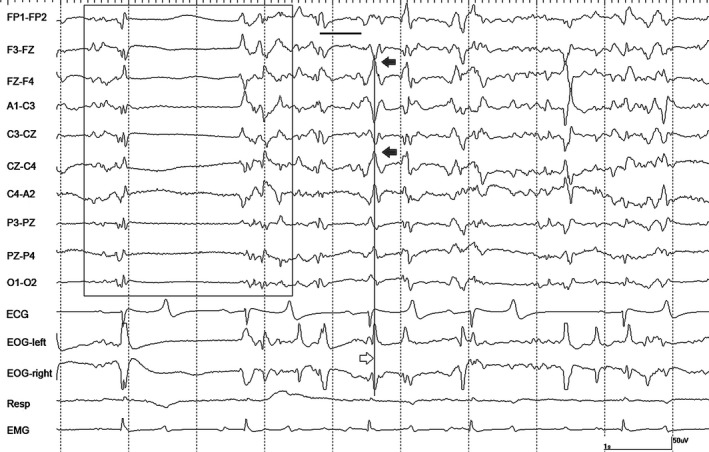
Figure 1.

A period of burst suppression (boxed) in horse #4 during isoflurane anesthesia at 1.2 MAC during controlled ventilation. Numerous sharp waves (filled arrows in EEG channels, open arrow in EOG tracings) several associated with voltage attenuation (thick horizontal line), are also present. Gain calibration is shown for EEG and EOG tracings only, others vary. The squaring off of some events recorded in EOG channels, denotes they are outside the dynamic range of the amplifiers.
