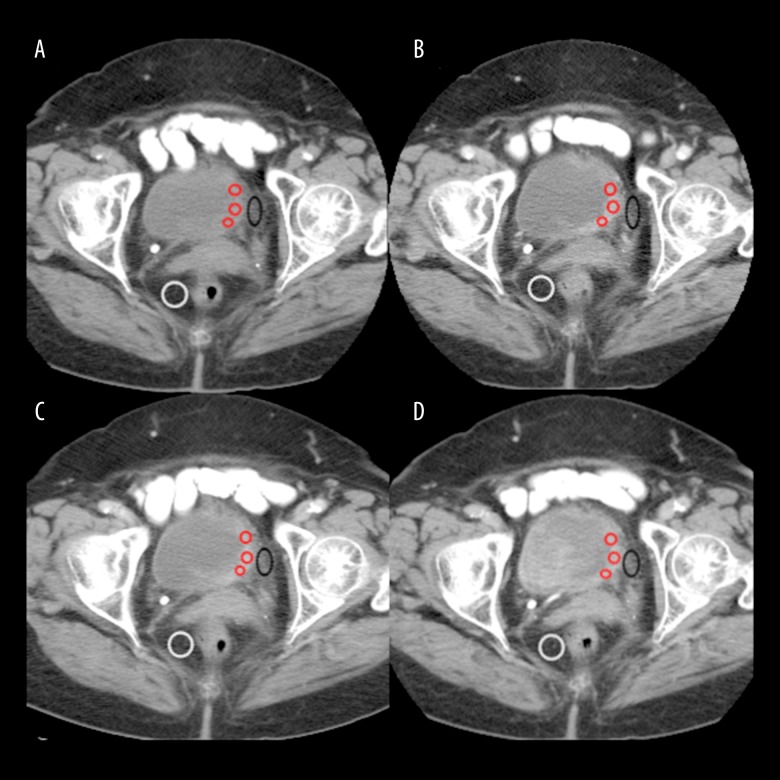
Figure 1.
Multiphasic CT images of bladder cancer. ROIs of tumour (red circles), ROI of perivesical fatty tissue (black circle) and ROI of perirectal fatty tissue are placed as shown in figures. The attenuation values of tumour are 49.07 HU on pre-contrast image (A), 96.1 HU on 60-second delay (B), 95,57 HU on 80-second delay (C) and 87.4 HU on 180-second delay (D).

