
Figure 6.
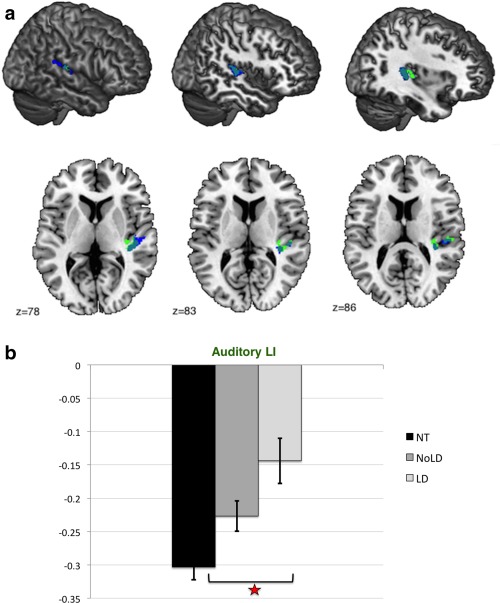
(a) Significant cluster (ASC with LD vs. controls). Sagittal slices of the MNI stereotactic atlas with superimposed significant between‐group differences in the auditory LI showing the overlap between significant clusters. Blue: Auditory cluster (all ASC‐controls); Green: Auditory cluster (ASC with LD‐controls). (b) Group differences in Auditory LI between individuals with ASC with and without LD and controls. Abbreviations: NT: neurotypicals (controls); NoLD: individuals with ASC without language delay; LD: individuals with ASC with language delay means and standard deviations of laterality indices extracted from the auditory cluster (ASC with LD vs. controls). Positive values indicate rightward asymmetry, and negative values indicate leftward asymmetry (with arbitrary unit). Individuals without language delay (NoLD) show an intermediate position between individuals with language delay (LD) and controls (NT) for the values extracted from the auditory cluster. [Color figure can be viewed in the online issue, which is available at http://wileyonlinelibrary.com.]