
Figure 8a.
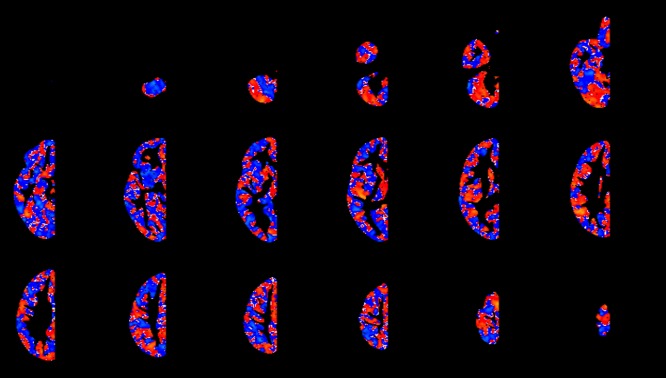
Non‐thresholded, descriptive t‐maps. Unthresholded t‐map of the ASC‐Control contrasts. Regions where ASC has larger LI values are shown in red, whereas regions where controls have larger LI values than ASC are shown in blue. [Color figure can be viewed in the online issue, which is available at http://wileyonlinelibrary.com.]