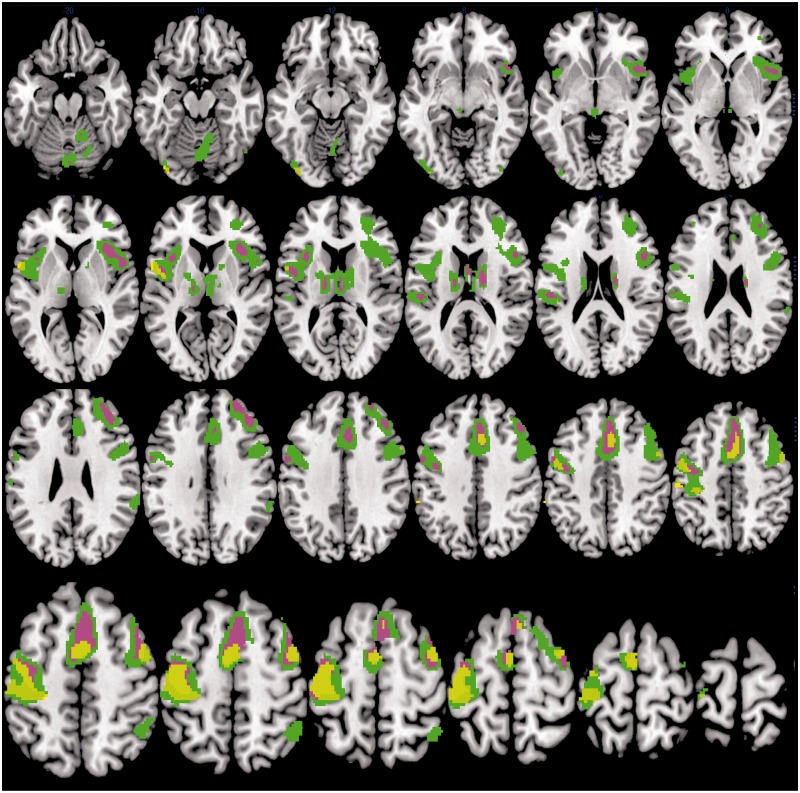
Figure 2.
Brain activity during the CPT task as compared with fixation for the overall group (N = 29), the +EDS group (n = 20), and the –EDS group (n = 9). Sites with significantly greater activation during task relative to fixation (CPT > fixation) are shown in green for the overall group, violet for the +EDS group, and yellow for the –EDS group. Random-effects analysis, p ≤ .05, voxel-corrected FWE, and cluster size of ≥5 voxels. Results are shown on an average structural image created from a template. Images are shown in neurological convention (left on left).

