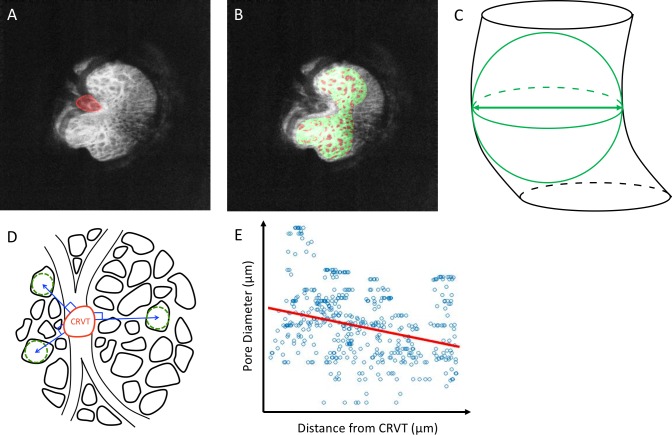
Figure 1.
(A) En-face slice of the LC with the CRVT manually delineated (red). (B) Automated segmentation showing the beams (green) as well as the pores (red) on a single C-mode slice from the 3D stack. (C) Schematic diagram demonstrating the quantification of pore (black) by local thickness defined in 3D (green). (D) Schematic diagram demonstrating the method of determining how LC pore diameter (green dashed lines) varied with distance from the CRVT (blue lines). (E) A linear fit (red line) of the association between pore diameter and distance from CRVT for a single eye.

