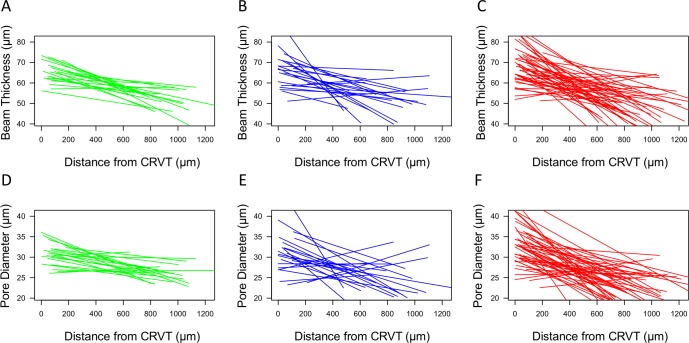
Figure 3.
Best fit lines for beam thickness (A–C) and pore diameter (D–F) changes per distance from the CRVT for each eye. The start and end of the line segment signifies the distance over which LC microstructure was visible for that eye. Green, healthy; Blue, glaucoma suspect; Red, glaucomatous eyes.

