
Figure 2:
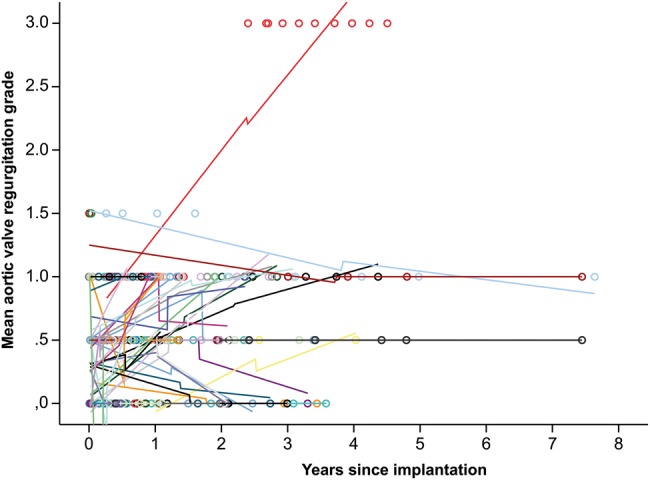
Valvular regurgitation over time in DAH (0 = none, 0.5 = trace, 1 = mild, 1.5 = mild to moderate, 2 = moderate, 2.5 = moderate to severe and 3 = severe). This figure shows the individual aortic valve insufficiency development and loess-smoothed interpolation lines. The decrease of insufficiency is not uncommon.