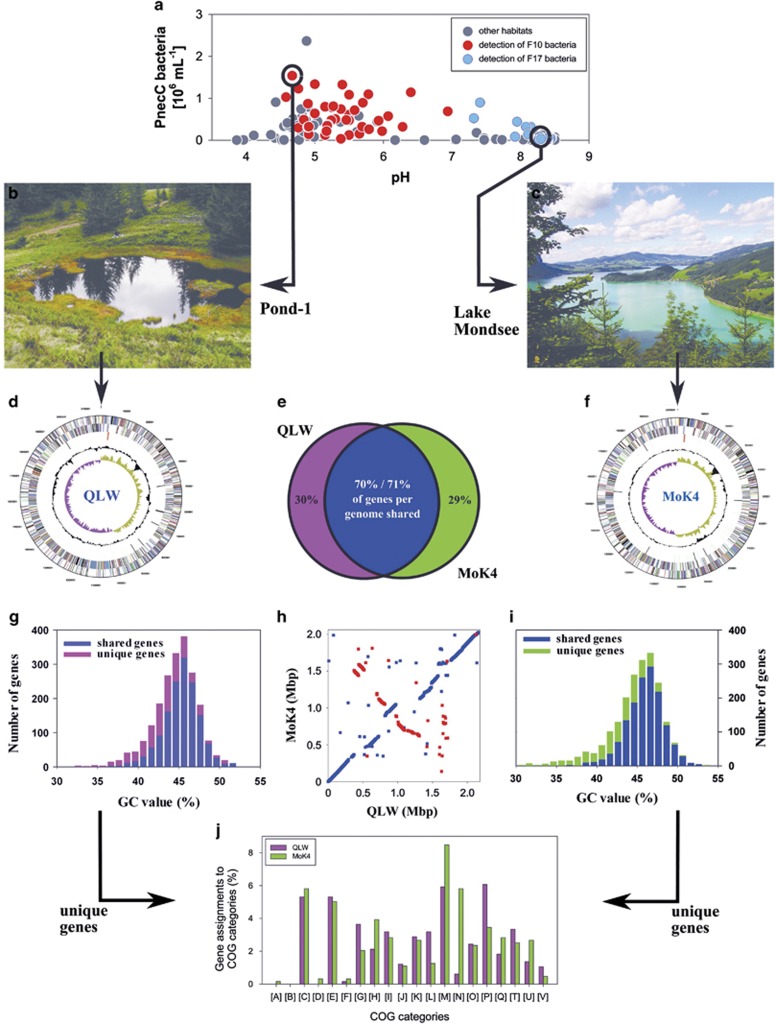
Figure 4.
Comparison of genomes of Polynucleobacter strains QLW-P1DMWA-1 (QLW) and MWH-MoK4 (MoK4) representing lineage F10 and F17, respectively. Graphs shown in the middle panel compare data of both taxa, graphs shown in the left and right panel show data on strain QLW and MoK4, respectively. (a) The F10 and F17 lineages seem not to co-occur in the same freshwater systems and seem to prefer habitats differing in pH values (data from Jezbera et al, 2011). (b) Acidic, dystrophic, shallow Pond-1 is the home habitat of strain QLW. (c) Alkaline, deep Lake Mondsee is the home habitat of strain MoK4. (d) Genome map of strain QLW, (f) genome map of strain MoK4. (e) Each strain shares about 70% of genes with the other strain, and about 30% of genes are unique to each strain. (g, i) GC content (mol%) of shared and unique genes. (h) Dot plot of positions of shared genes in the two genomes. Blue and red dots depict genes oriented in the same and the opposite orientation in the compared genomes. (j) Comparison of distribution of unique genes assigned to clusters of orthologous group (COG) categories shown as percentage of total numbers of unique genes in each genome.

