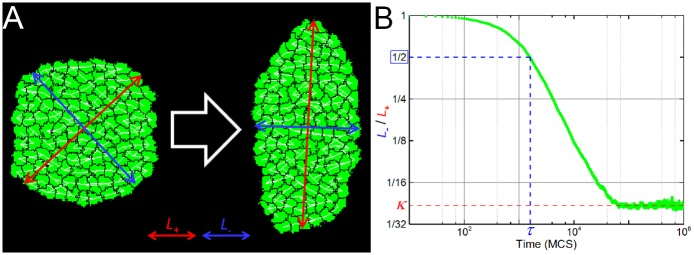
Fig 3. Simulation snapshots and metrics.
(A) Snapshots of a 2D simulation with reference parameter values, showing the initial configuration (left) and the configuration when the length of the major axis (L+, red lines) increases to twice the length of the minor axis (L-, blue lines), i.e., κ = 0.5. The simulation contains N = 109 cells (in green) with the tension forces shown by the white segments connecting their centers-of-mass. (B) Graph of L-/L+ versus time for the reference 2D simulation. For all simulations we measured the final value of the ratio between the length of minor and major axes of the tissue κ (shown in red), and the time τ (shown in blue) when the length of the major axis doubles the length of the minor axis (L-/L+ = 0.5).

