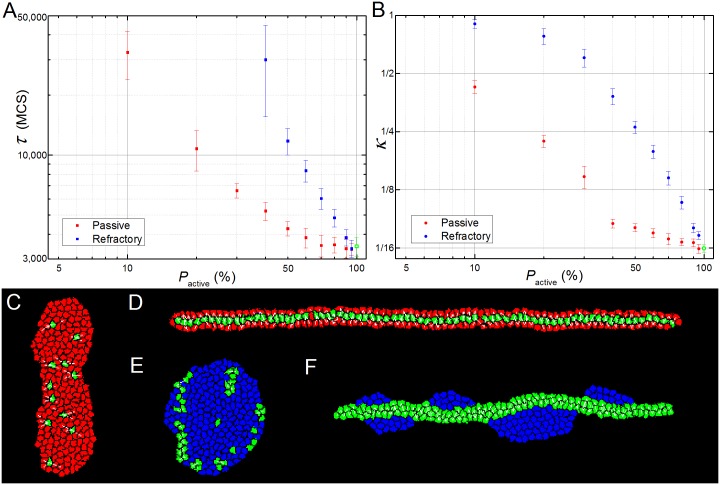
Fig 9. Simulation results for heterogeneous tissues.
(A) Dependency of parameter κ with the percentage of passive (red dots) and refractory (blue squares) cells. (B) Dependency of parameter τ with the percentage of passive (red dots) and refractory (blue squares) cells. For both graphs, the measured value for the homogeneous tissue is represented by the green open square (A) or dot (B). Values of κ are measured for the whole tissue (active and non-active cells). (C-D) Simulations with passive cells; (E-F) simulations with refractory cells. (C) On a simulation with 95% of passive cells (in red) the remaining 5% of active cells (green) are still able to induce some degree of CE. (D) In a typical simulation with a higher percentage of active cells (here 33%) the active cells align at the center line of the extending tissue. (E) A failed CE for a tissue with less than 20% of active cells (here, 82% of refractory cells, blue). (F) When the percentage of active cells is above 20% (here 54%) the two populations sort out, with the active cells forming an elongated tissue and the refractory cells lying on each side of the structure. Panels (D) and (F) were rotated 90° for visualization purposes.

