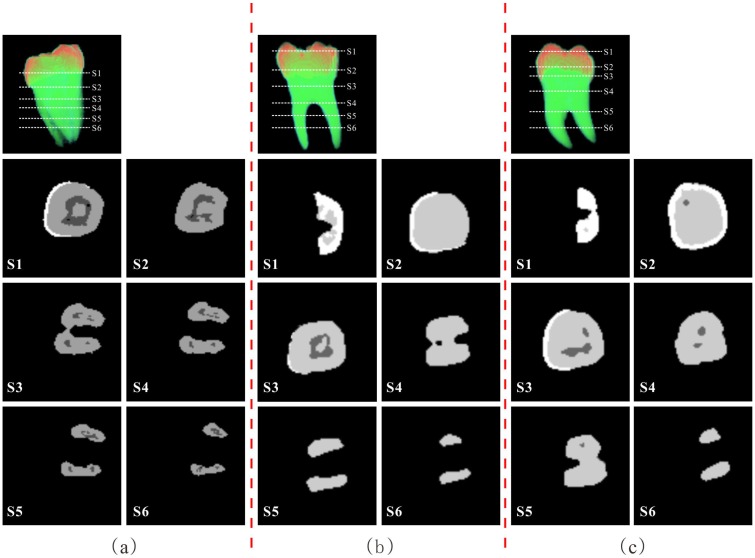
Fig 8. Segmentation and classification results for three MicroCT tooth datasets.
For each two column (separated by red dot line), the first top image is the volume rendering of the dataset and the cross-sectional positions in white dot lines. Its segmentation and classification result of each cross-sectional slice is shown in each column.

