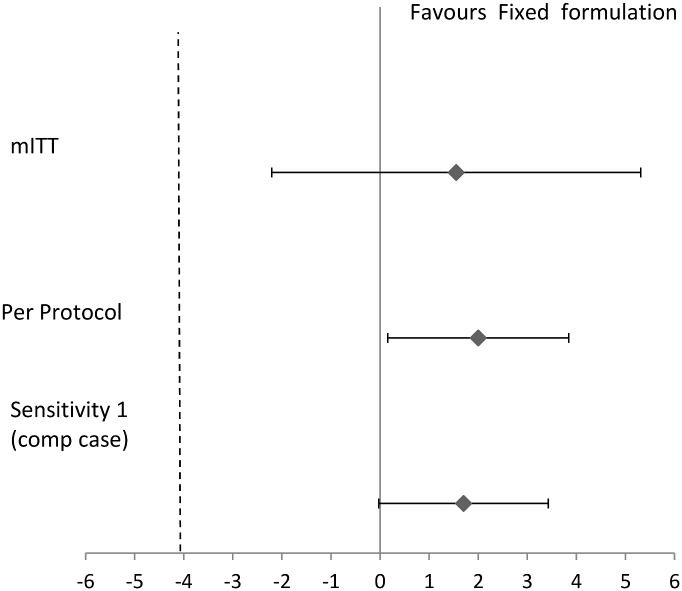
Fig 2. Evidence of Non Inferiority.
The dotted lines indicate the margin on non-inferior for the difference between the FDC and the LF region. Error bars represent the 90% confidence interval in the risk difference. In Sensitivity 1 is a complete case analysis where all missing EOT culture results in the mITT cohort are excluded. PP indicates per protocol.

