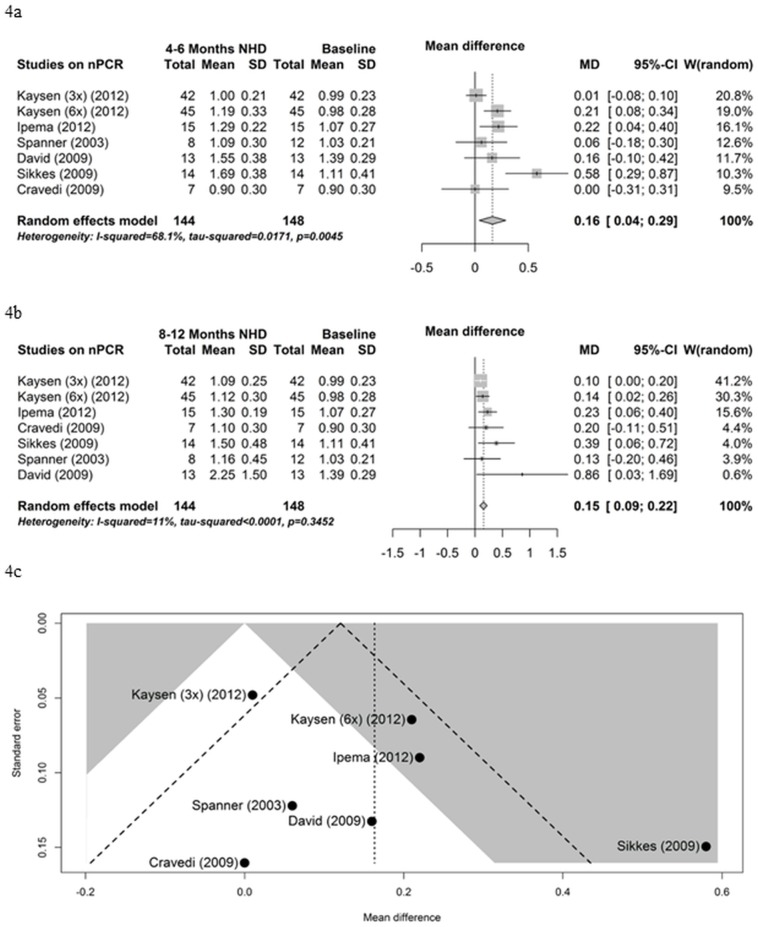
Fig 4. normalized Protein Catabolic Rate.
(4a) Forest plot comparing nPCR in NHD patients at baseline (prior to beginning NHD) and after 4–6 months on NHD. (4b) Forest plot comparing nPCR in NHD patients at baseline (prior to beginning NHD) and after 8–12 months on NHD. (4c) Funnel plot comparing nPCR in NHD patients at baseline (prior to beginning NHD) and after 4–6 months on NHD.

