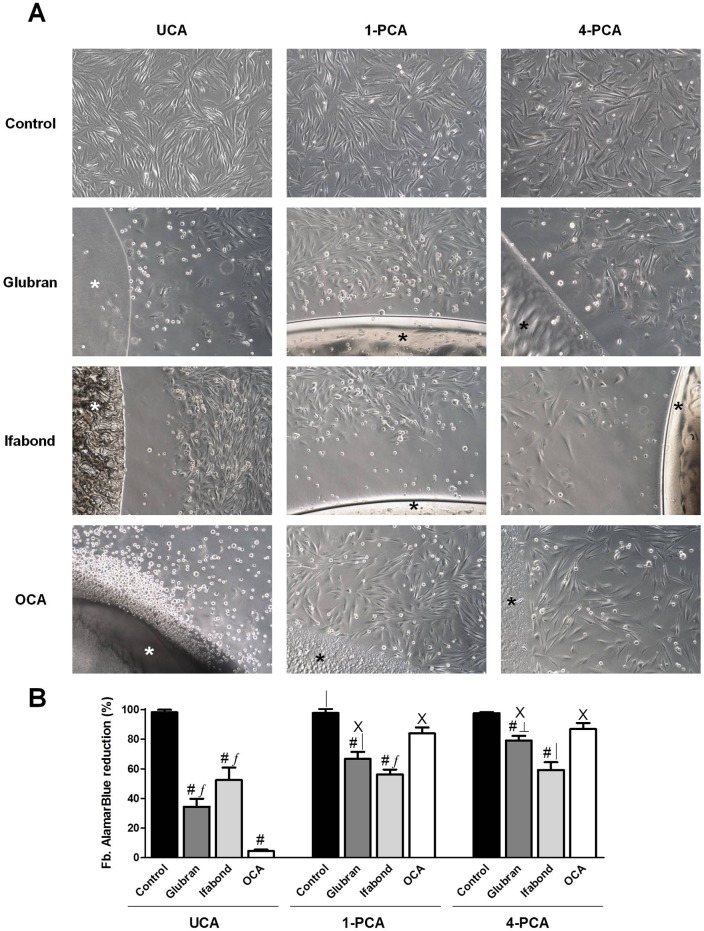
Fig 2. Fibroblast cell viability.
(A) Macroscopic visual assessment. Images of the cultured fibroblasts after 24 hours of exposure to unpolymerized CAs (UCA) and polymerized for 1 and 4 days (1-PCA and 4-PCA) different CAs (Glubran, Ifabond, and OCA) vs. non-exposed cells (control) (100x). (*: Tissue Adhesive). (B) Mean percentage of the Alamar Blue reduction from fibroblast cultures after exposure to the different CAs. The results are expressed as the mean ± SEM for 3 independent assays performed in quadruplicate. Comparisons between groups: #: vs. control (***; p<0.001); ∫: vs. OCA (***; p<0.001); │: vs. OCA (**; p<0.01); ┴: vs Ifabond (**; p<0.01). Comparisons between times: Χ: vs. UCA (***; p<0.001).

