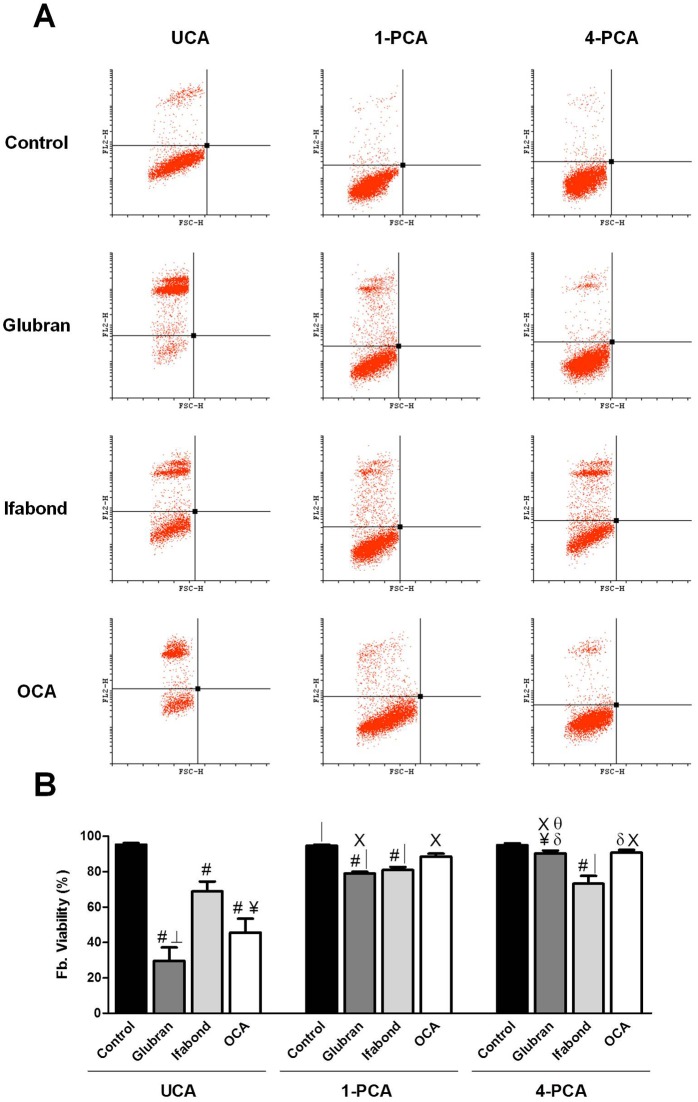
Fig 4. Fibroblast flow cytometry.
(A) Scatter plots of the fibroblast cell populations after exposure to unpolymerized CAs (UCA) and polymerized for 1 and 4 days (1-PCA and 4-PCA) different CAs (Glubran, Ifabond, and OCA) vs. non-exposed cells (control) after 24 hours of culture. (B) Rate of cell viability of the fibroblast cell populations after exposure to the different CAs. The results are expressed as the mean ± SEM for 3 independent assays performed in quadruplicate. Comparisons between groups: #: vs. control (***; p<0.001); δ: vs. control (*; p<0.05); │: vs. OCA (**; p<0.01); ┴: vs Ifabond (**; p<0.01); ¥: vs Ifabond (*; p<0.05). Comparisons between times: Χ: vs. UCA (***; p<0.001); θ: vs. 1-PCA (***; p<0.001).

