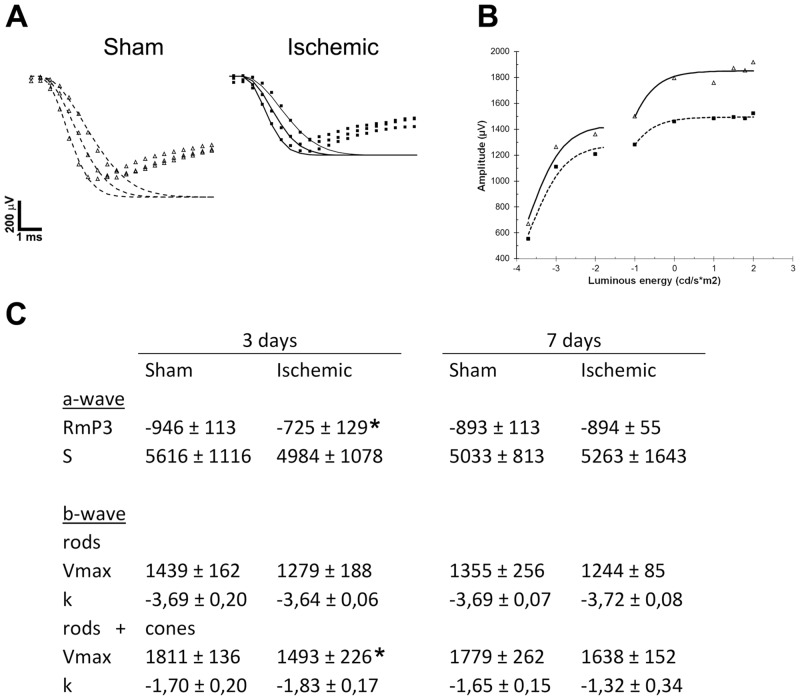
Fig 4. The falling phase of a-wave, Naka-Rushton modelling, and a representation plotted parameters of sham and ischemic rats.
(A) The falling phase of a-wave responses to stimuli of 1.5, 1.75 and 2.0 log cd*s/m2 were modelled for both sham (unfilled triangles) and ischemic animals (filled squares). (B) Average b-wave responses at day 3 for sham operated (unfilled triangles) and ischemic (filled squares) are plotted here against luminous intensity. These responses were modelled using a Naka-Rushton function (dotted and continuous lines, respectively). (C) Optimization of the parameters for these functions (A, B) were made and averaged for both experimental groups, shown here for both 3 and 7 days after operation. Unit for S is log m2*cd-1*s-3; unit for k is log cd*s/m2; unit for RmP3 and Vmax is μV; * indicates p<0.05.

