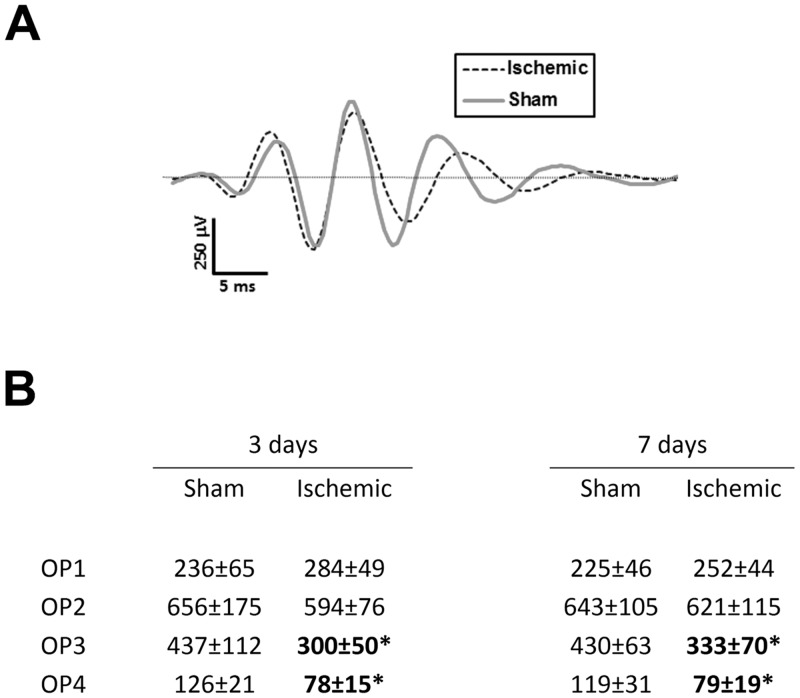
Fig 5. Oscillatory potential wavelets and average amplitudes or representative individuals from both sham and ischemic groups.
(A) OP wavelets isolated from ERG traces (luminance: 2.0 log cd*s/m2) from one animal which is representative of each experimental group on day 3. (B) Average OP amplitudes for each experimental group at 3 and 7 days after surgery. Unit for amplitudes is μV; * denotes p<0.05.

