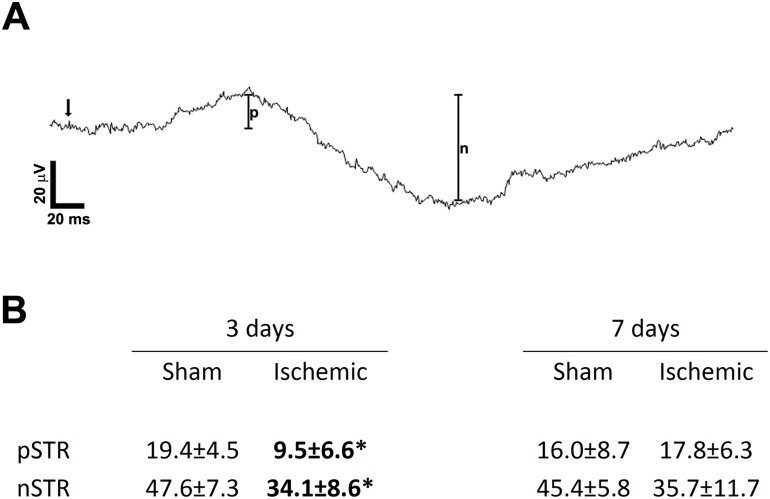
Fig 6. STR responses with average amplitudes of both sham and ischemic animals at 3 and 7 days post ischemia.
(A) The amplitude of the pSTR was measured from baseline to the peak of the first positive potential (denoted by p) in response to a stimulus of -5.8 log cd*s/m2. The amplitude of the nSTR was measured from this peak to the trough of the following negative potential (denoted by n). (B) Average pSTR and nSTR amplitudes for each experimental group at days 3 and 7 after surgery. Arrow indicates time of stimulus; unit for amplitudes is μV; * denotes p<0.05.

